Single compound comparisons
Contents
3.6. Single compound comparisons#
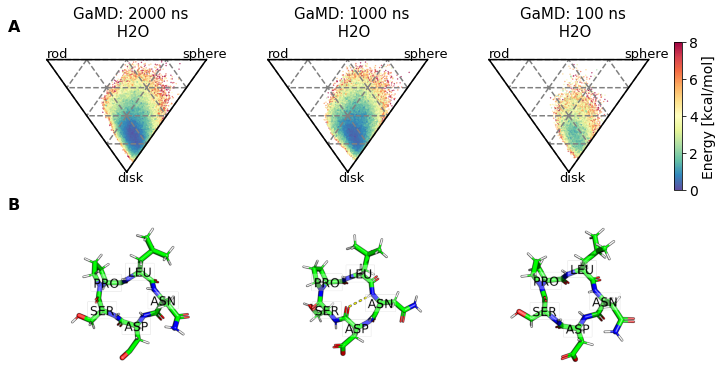
In this notebook, we compare up to 3 MD simulations of a single compound and optionally also a cheminformatics conformer generator.
This notebook refers to compound 22.
3.6.1. Imports & file inputs#
import matplotlib
%matplotlib inline
#matplotlib.use("Agg")
import matplotlib.pyplot as plt
import matplotlib.tri as tri

# set matplotlib font sizes
SMALL_SIZE = 13
MEDIUM_SIZE = 14
BIGGER_SIZE = 15

plt.rc('font', size=MEDIUM_SIZE)          # controls default text sizes
plt.rc('axes', titlesize=BIGGER_SIZE)     # fontsize of the axes title
plt.rc('axes', labelsize=MEDIUM_SIZE)    # fontsize of the x and y labels
plt.rc('xtick', labelsize=MEDIUM_SIZE)    # fontsize of the tick labels
plt.rc('ytick', labelsize=MEDIUM_SIZE)    # fontsize of the tick labels
plt.rc('legend', fontsize=MEDIUM_SIZE)    # legend fontsize
plt.rc('figure', titlesize=BIGGER_SIZE)  # fontsize of the figure title

DPI = 600

import mdtraj as md
import numpy as np
import scipy.cluster.hierarchy
from scipy.spatial.distance import squareform
import pandas as pd
sys.path.append(os.getcwd())
from src.pyreweight import reweight
from src.noe import compute_NOE_mdtraj, plot_NOE
from src.utils import json_load, dotdict
import src.utils
import src.dihedrals
import src.pyreweight
from sklearn.manifold import TSNE
from sklearn.cluster import DBSCAN
from sklearn.neighbors import NearestNeighbors
from sklearn.decomposition import PCA
# read in stride from config file
stride = int(snakemake.config['stride'])
stride = 1

compound_index = int(snakemake.wildcards.compound_dir)
display(Markdown(f"Analysing Compound {compound_index}"))

compound = json_load(snakemake.input.parm)
multi = compound.multi

if multi is not None:
    display(Markdown('Multiple compounds detected'))
    display(Markdown(print(multi)))
    multi = {v: k for k, v in multi.items()}
    multiple = True
else:
    multiple = False
    display(Markdown('Single compound only (no exp. cis/trans data known)'))
Analysing Compound 22
Single compound only (no exp. cis/trans data known)
# File inputs
methods = {}
repeats = {}
simtime = {}
solvent = {}
boosting = {}
dihe_all = {}
multi_details = {}
for i in range(3):
    # Load MD details
    methods[i] = snakemake.params[f"sample_{i}"]['method']
    simtime[i] = snakemake.params[f"sample_{i}"]['simtime']
    repeats[i] = snakemake.params[f"sample_{i}"]['repeats']
    solvent[i] = snakemake.params[f"sample_{i}"]['solvent']
    dihe_all[i] = src.utils.pickle_load(snakemake.input[f"red_dihe_{i}"])
    if snakemake.params[f"sample_{i}"]['igamd'] != "nan":
        boost = snakemake.params[f"sample_{i}"]['igamd']
        if boost == str(3):
            boosting[i] = "boost: dual"
        elif boost == str(2):
            boosting[i] = "boost: dihe"
        elif boost == str(1):
            boosting[i] = "boost: totE"
    else:
        boosting[i] = ""
    if multiple:
        multi_details[i] = src.utils.pickle_load(snakemake.input[f"multiple_{i}"])
        multi_plots = 2
    else:
        multi_plots = 1

if snakemake.params[f"sample_{1}"] == snakemake.params[f"sample_{2}"]:
    no_md = 2
else:
    no_md = 3

if multiple:
    cis = []
    trans = []
    for i in range(3):
        cis_temp, trans_temp = src.utils.pickle_load(snakemake.input[f"multiple_{i}"])
        cis.append(cis_temp)
        trans.append(trans_temp)
3.6.2. Dihedral PCA comparison#
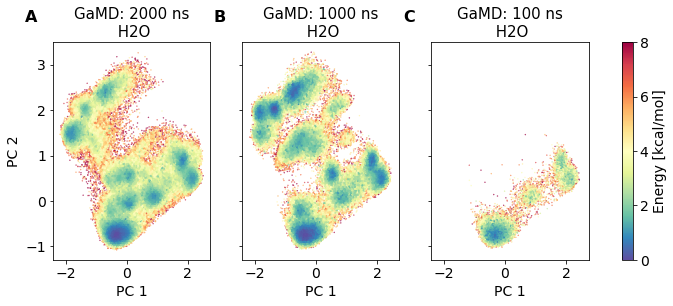
The following dihedral PCA plots compare the different MD simulations. The middle and left dPCA plots are in the PCA space of the left most plot.
dihe_r = {}  # This stores the reduced dihedrals
# Load pca object of reference MD simulation (0)
pca = src.utils.pickle_load(snakemake.input.dPCA_0)#PCA(n_components=2)
dihe_r[0] = pca.transform(dihe_all[0])
dihe_r[0].shape
# Now apply the same transformation to second and third
dihe_r[1] = pca.transform(dihe_all[1])
dihe_r[2] = pca.transform(dihe_all[2])

display(Markdown(f"The two components explain {sum(pca.explained_variance_ratio_):.2%} of the variance"))
The two components explain 34.60% of the variance
# Reweighting:
weights = {}
weight_data = {}
for i in range(3):
    # The following would read pre-computed weights. But does not work here b/c computed for wrong PCA space!
    #weights[i] = src.utils.pickle_load(snakemake.input[f"dPCA_weights_MC_{i}"])
    if methods[i] != 'cMD':
        weight_data[i] = np.loadtxt(snakemake.input[f"weights_{i}"])
        weight_data[i] = weight_data[i][::stride]
        weights[i] = reweight(dihe_r[i], snakemake.input[f"weights_{i}"], 'amdweight_MC', weight_data[i])
    else:
        weights[i] = reweight(dihe_r[i], None, 'noweight')

zs = np.concatenate([weights[0], weights[1], weights[2]], axis=0)
min_, max_ = zs.min(), zs.max()
min_ = 0
max_ = 8
# Plot re-weighted PCA plots with extended labels
fig, axs = plt.subplots(1,no_md+1, sharex='all', sharey='all', figsize=(16,4))
scat = {}
for i in range(no_md):
    scat[i] = axs[i].scatter(dihe_r[i][:,0], dihe_r[i][:,1], c=weights[i], marker='.', cmap='Spectral_r', s=0.5, vmin=min_, vmax=max_, rasterized=True)
    axs[i].set_title(f"{methods[i]}: {simtime[i]} ns (r# {repeats[i]}).\n {solvent[i]},\n {boosting[i]}")
    axs[no_md].scatter(dihe_r[i][:,0], dihe_r[i][:,1], marker='.', s=0.5, alpha=0.1, label=f"{methods[i]}: {simtime[i]} ns (r# {repeats[i]}).\n {solvent[i]}, {boosting[i]}", rasterized=True)

lgnd = axs[no_md].legend(bbox_to_anchor=(1.05,1), loc='upper left')
for handle in lgnd.legendHandles:
    handle.set_sizes([30.0])
    handle.set_alpha(1)

axs[no_md].set_title('Overlay')

colorbar = fig.colorbar(scat[0], ax=axs, label="Energy [kcal/mol]", location='left', anchor=(1.5,0))
fig.savefig(snakemake.output.pca_dihe, bbox_inches='tight', dpi=600)

# Publication/report quality figure:
# Plot re-weighted PCA plots
fig, axs = plt.subplots(multi_plots,no_md, sharex='all', sharey='all', figsize=(12,4*multi_plots))

scat = {}
panel_labels = ['A', 'B', 'C']
panel_labels = panel_labels[0:no_md]
for i, panel in enumerate(panel_labels):
    if multiple:
        # cis
        scat[i] = axs.flatten()[i].scatter(dihe_r[i][multi_details[i][0],0], dihe_r[i][multi_details[i][0],1], c=weights[i][multi_details[i][0]], marker='.', cmap='Spectral_r', s=0.5, vmin=min_, vmax=max_, rasterized=True)
        axs.flatten()[i].set_title(f"{methods[i]}: {simtime[i]} ns\n {solvent[i]}, cis")
        axs.flatten()[i].text(-0.1, 1.15, panel, transform=axs.flatten()[i].transAxes,fontsize=16, fontweight='bold', va='top', ha='right')
        # trans
        scat[i+2] = axs.flatten()[i+2].scatter(dihe_r[i][multi_details[i][1],0], dihe_r[i][multi_details[i][1],1], c=weights[i][multi_details[i][1]], marker='.', cmap='Spectral_r', s=0.5, vmin=min_, vmax=max_, rasterized=True)
        axs.flatten()[i+2].set_title(f"{methods[i]}: {simtime[i]} ns\n {solvent[i]}, trans")
        axs.flatten()[i+2].set_xlabel('PC 1')
    else:
        scat[i] = axs.flatten()[i].scatter(dihe_r[i][:,0], dihe_r[i][:,1], c=weights[i], marker='.', cmap='Spectral_r', s=0.5, vmin=min_, vmax=max_, rasterized=True)
        axs.flatten()[i].set_title(f"{methods[i]}: {simtime[i]} ns\n {solvent[i]}")
        axs.flatten()[i].set_xlabel('PC 1')
        axs.flatten()[i].text(-0.1, 1.15, panel, transform=axs.flatten()[i].transAxes,fontsize=16, fontweight='bold', va='top', ha='right')
axs.flatten()[0].set_ylabel('PC 2')
if multiple:
    axs.flatten()[2].set_ylabel('PC 2')
    colorbar = fig.colorbar(scat[0], ax=axs, label="Energy [kcal/mol]", location='right')
else:
    colorbar = fig.colorbar(scat[0], ax=axs, label="Energy [kcal/mol]", location='right')
fig.savefig(snakemake.output.report_pca_comparison, bbox_inches='tight', dpi=600)
3.6.3. Compare MD clusters#
# Load cluster data
clusters = []
for i in range(no_md):
    try:
        clust_struct = md.load(snakemake.input[f'clusters_{i}'])
    except:
        clust_struct = None
    clusters.append(clust_struct)

# Transform clusters in pca
clusters_dih = []
[clusters_dih.append(src.dihedrals.getReducedDihedrals(clus)) for clus in clusters]
cluster_pca = []
[cluster_pca.append(pca.transform(clus)) for clus in clusters_dih]
[None, None, None]
# Plot Clusters
fig, ax = plt.subplots()

for i in range(no_md):
    ax.scatter(dihe_r[i][:,0], dihe_r[i][:,1], marker='.', s=0.5, alpha=0.1, c='grey', rasterized=True)

# Plot clusters
for clus, method in zip(cluster_pca, list(methods.values())):
    ax.scatter(clus[:,0], clus[:,1], marker='^', label=method)
    for i, txt in enumerate(np.arange(len(clus[:,0]))):
        ax.annotate(txt, (clus[i,0], clus[i,1], ))
ax.legend()
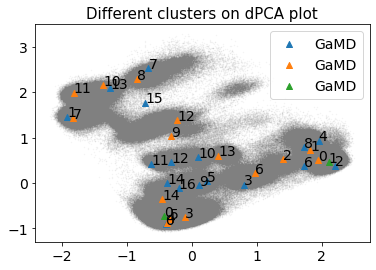
ax.set_title("Different clusters on dPCA plot")
fig.savefig(snakemake.output.cluster_pca, dpi=600)
/biggin/b147/univ4859/research/snakemake_conda/b998fbb8f687250126238eb7f5e2e52c/lib/python3.7/site-packages/ipykernel_launcher.py:14: UserWarning: Creating legend with loc="best" can be slow with large amounts of data.

/biggin/b147/univ4859/research/snakemake_conda/b998fbb8f687250126238eb7f5e2e52c/lib/python3.7/site-packages/IPython/core/pylabtools.py:151: UserWarning: Creating legend with loc="best" can be slow with large amounts of data.
  fig.canvas.print_figure(bytes_io, **kw)
3.6.4. Shape comparison#
# Shape comparison plots - Load shapes
shape = {}
shape_weights = {}
for i in range(no_md):
    shape[i] = src.utils.pickle_load(snakemake.input[f"shape_{i}"])
    shape_weights[i] = src.utils.pickle_load(snakemake.input[f"shape_weights_MC_{i}"])
fig, axs = plt.subplots(1,no_md, sharex='all', sharey='all')
fig.set_size_inches(16/3 * no_md,4)

# create the grid
corners = np.array([[1, 1], [0.5, 0.5], [0,1]])
triangle = tri.Triangulation(corners[:, 0], corners[:, 1])

# creating the outline
refiner = tri.UniformTriRefiner(triangle)
outline = refiner.refine_triangulation(subdiv=0)

# creating the outline
refiner = tri.UniformTriRefiner(triangle)
trimesh = refiner.refine_triangulation(subdiv=2)

scat = {}
for i, panel in enumerate(panel_labels):
    scat[i] = axs[i].scatter(shape[i][:,0], shape[i][:,1], c=shape_weights[i], marker='.', cmap='Spectral_r', s=0.5, vmin=min_, vmax=max_, rasterized=True)
    axs[i].set_title(f"{methods[i]}: {simtime[i]} ns\n {solvent[i]}")
    axs[i].set_xlabel(r'$I_{1}/I_{3}$')
    axs[i].triplot(trimesh,'--', color='grey')
    axs[i].triplot(outline,'k-')
    axs[i].text(0 ,1.01, 'rod', fontsize=SMALL_SIZE)
    axs[i].text(0.85 ,1.01, 'sphere', fontsize=SMALL_SIZE)
    axs[i].text(0.44 ,0.48, 'disk', fontsize=SMALL_SIZE)
    axs[i].scatter(0, 1.05,alpha=0, s=0.1)
    axs[i].scatter(1.05, 1.05,alpha=0, s=0.5)
    axs[i].scatter(0.5, 0.45,alpha=0, s=0.5)
    axs[i].axis('off')
    axs[i].text(-0.1, 1.15, panel, transform=axs[i].transAxes,fontsize=16, fontweight='bold', va='top', ha='right')

axs[0].set_ylabel('$I_{2}/I_{3}$')

colorbar = fig.colorbar(scat[0], ax=axs, label="Energy [kcal/mol]", location='right', anchor=(0,0))
# fig.tight_layout()
fig.savefig(snakemake.output.shape_comparsion, dpi=600)  #  bbox_inches='tight',

clusters = [snakemake.input.clusters_0, snakemake.input.clusters_1, snakemake.input.clusters_2]
fig, axs = plt.subplots(1,no_md, figsize=(9,4))
for i, panel in enumerate(panel_labels):
    pymol_render = src.utils.pymol_image(clusters[i], ref=snakemake.input.clusters_0, label=True)
    axs[i].set_title(f"{methods[i]}: {simtime[i]} ns\n {solvent[i]}")
    axs[i].axis('off')
    axs[i].text(-0.1, 1.15, panel, transform=axs[i].transAxes,fontsize=16, fontweight='bold', va='top', ha='right')
    axs[i].imshow(pymol_render)
fig.tight_layout()
fig.savefig(snakemake.output.cluster_hbonds, dpi=600)
fig, axs = plt.subplots(2,no_md, sharex='row', sharey='row')
fig.set_size_inches(12/3 * no_md,6)

# create the grid
corners = np.array([[1, 1], [0.5, 0.5], [0,1]])
triangle = tri.Triangulation(corners[:, 0], corners[:, 1])

# creating the outline
refiner = tri.UniformTriRefiner(triangle)
outline = refiner.refine_triangulation(subdiv=0)

# creating the outline
refiner = tri.UniformTriRefiner(triangle)
trimesh = refiner.refine_triangulation(subdiv=2)

scat = {}
for i, panel in enumerate(panel_labels):
    scat[i] = axs[0,i].scatter(shape[i][:,0], shape[i][:,1], c=shape_weights[i], marker='.', cmap='Spectral_r', s=0.5, vmin=min_, vmax=max_, rasterized=True)
    axs[0,i].set_title(f"{methods[i]}: {simtime[i]} ns\n {solvent[i]}")
    axs[0,i].set_xlabel(r'$I_{1}/I_{3}$')
    axs[0,i].triplot(trimesh,'--', color='grey')
    axs[0,i].triplot(outline,'k-')
    axs[0,i].text(0 ,1.01, 'rod', fontsize=SMALL_SIZE)
    axs[0,i].text(0.85 ,1.01, 'sphere', fontsize=SMALL_SIZE)
    axs[0,i].text(0.44 ,0.46, 'disk', fontsize=SMALL_SIZE)
    axs[0,i].scatter(0, 1.05,alpha=0, s=0.1)
    axs[0,i].scatter(1.05, 1.05,alpha=0, s=0.5)
    axs[0,i].scatter(0.5, 0.45,alpha=0, s=0.5)
    axs[0,i].axis('off')
axs[0,0].text(-0.1, 1.15, "A", transform=axs[0,0].transAxes, fontsize=16, fontweight='bold', va='top', ha='right')
axs[0,0].set_ylabel('$I_{2}/I_{3}$')

clusters = [snakemake.input.clusters_0, snakemake.input.clusters_1, snakemake.input.clusters_2]
for i, panel in enumerate(panel_labels):
    pymol_render = src.utils.pymol_image(clusters[i], ref=snakemake.input.clusters_0, label=True)
#     axs[i].set_title(f"{methods[i]}: {simtime[i]} ns\n {solvent[i]}")
    axs[1,i].axis('off')
#     axs[i].text(-0.1, 1.15, panel, transform=axs[i].transAxes,fontsize=16, fontweight='bold', va='top', ha='right')
    axs[1,i].imshow(pymol_render)
axs[1,0].text(-0.25, 1.15, "B", fontsize=16, transform=axs[1,0].transAxes, fontweight='bold', va='top', ha='right')
fig.subplots_adjust(right=0.85)
# get lower left (x0,y0) and upper right (x1,y1) corners
[[x10,y10],[x11,y11]] = axs[0,no_md-1].get_position().get_points()
pad = 0.01; width=0.01
cax = fig.add_axes([x11+pad, y10, width, y11-y10])
colorbar = fig.colorbar(scat[0], cax=cax, label="Energy [kcal/mol]")
fig.savefig(snakemake.output.cluster_hbonds, bbox_inches='tight', dpi=600)  #
3.6.5. Cheminformatics conformer generators (optional)#
snakemake.wildcards.confgens
'0_0'
# Load conformer generator structures
if snakemake.wildcards.confgens != "0_0":
    confgen_number = int(len(snakemake.wildcards.confgens.split("_")) / 2)
    confgens = snakemake.wildcards.confgens.split("_")
    confgen_name = []
    for idx, (j,k) in enumerate(zip(confgens[0::2], confgens[1::2])):
        confgen_name.append(f"{j}:{k}")
    chem_info_t = [md.load(snakemake.input[f"cheminfoconfs{i}"]) for i in range(confgen_number)]
    print(chem_info_t)

    chem_info_dihe_r = {}
    chem_info_shapes = {}
    for i, chem_t in enumerate(chem_info_t):
        chem_info_dihedrals = src.dihedrals.getReducedDihedrals(chem_t)
        chem_info_dihe_r[i] = pca.transform(chem_info_dihedrals)

        # compute shape
        inertia_tensor = md.compute_inertia_tensor(chem_t)
        principal_moments = np.linalg.eigvalsh(inertia_tensor)

        # Compute normalized principal moments of inertia
        npr1 = principal_moments[:,0] / principal_moments[:,2]
        npr2 = principal_moments[:,1] / principal_moments[:,2]
        chem_info_shapes[i] = np.stack((npr1, npr2), axis=1)
else:
    confgen_number = 1
# Compare all cheminformatics conformer generators to md reference
all_panel_labels = ['A','B','C','D','E','F','G','H','I','J','K','L','M','N','O','P','Q','R','S']
n_row, n_col, figsize = src.utils.determine_no_plots(confgen_number)
fig, axs = plt.subplots(n_row,n_col, sharex='all', sharey='all', figsize=figsize)
if snakemake.wildcards.confgens != "0_0":
    scat = {}
    ref_label = f"{methods[0]}: {simtime[0]} ns\n {solvent[0]}"
    for i in range(confgen_number):
        scat[i] = axs.flatten()[i].scatter(dihe_r[0][:,0], dihe_r[0][:,1], c=weights[0], cmap='Spectral_r', marker='.', s=0.5, vmin=0, vmax=8, rasterized=True, label=ref_label)
        scat[i] = axs.flatten()[i].scatter(chem_info_dihe_r[i][:,0], chem_info_dihe_r[i][:,1], marker='s', s=6, color='black', label=confgen_name[i]) #, c=weights[i], marker='.', cmap='Spectral_r', s=0.5, vmin=min_, vmax=max_)
        axs.flatten()[i].set_title(confgen_name[i])
        axs[i].set_xlabel('PC 1')
        axs.flatten()[i].legend(bbox_to_anchor=(0,-0.4), loc='lower left', borderaxespad=0)
        axs.flatten()[i].text(-0.1, 1.15, all_panel_labels[i], transform=axs[i].transAxes,fontsize=16, fontweight='bold', va='top', ha='right')
    axs[0].set_ylabel('PC 2')
    fig.tight_layout()
fig.savefig(snakemake.output.all_cheminfo_comp_pca, dpi=600)
# Plot shapes
n_row, n_col, figsize = src.utils.determine_no_plots(confgen_number,4,3)
fig, axs = plt.subplots(n_row,n_col, sharex='all', sharey='all', figsize=figsize)

if snakemake.wildcards.confgens != "0_0":
    # create the grid
    corners = np.array([[1, 1], [0.5, 0.5], [0,1]])
    triangle = tri.Triangulation(corners[:, 0], corners[:, 1])

    # creating the outline
    refiner = tri.UniformTriRefiner(triangle)
    outline = refiner.refine_triangulation(subdiv=0)

    # creating the outline
    refiner = tri.UniformTriRefiner(triangle)
    trimesh = refiner.refine_triangulation(subdiv=2)

    scat = {}
    for i in range(confgen_number):
        scat[i] = axs.flatten()[i].scatter(shape[0][:,0], shape[0][:,1], c=shape_weights[0], marker='.', cmap='Spectral_r', s=0.5, vmin=0, vmax=8, rasterized=True, label=ref_label)
        axs.flatten()[i].scatter(chem_info_shapes[i][:,0], chem_info_shapes[i][:,1], marker='.', c='black', s=4, label=confgen_name[i])
        axs.flatten()[i].set_xlabel(r'$I_{1}/I_{3}$')
        axs.flatten()[i].triplot(trimesh,'--', color='grey')
        axs.flatten()[i].triplot(outline,'k-')
        axs.flatten()[i].text(0, 1.01, 'rod', fontsize=SMALL_SIZE)
        axs.flatten()[i].text(0.85, 1.01, 'sphere', fontsize=SMALL_SIZE)
        axs.flatten()[i].text(0.44, 0.45, 'disk', fontsize=SMALL_SIZE)
        axs.flatten()[i].scatter(0, 1.05, alpha=0, s=0.1)
        axs.flatten()[i].scatter(1.05, 1.05, alpha=0, s=0.5)
        axs.flatten()[i].scatter(0.5, 0.45, alpha=0, s=0.5)
        axs.flatten()[i].axis('off')
        axs.flatten()[i].set_title(confgen_name[i])
        axs.flatten()[i].legend(bbox_to_anchor=(0,-0.4), loc='lower left', borderaxespad=0)
        axs.flatten()[i].text(-0.1, 1.15, all_panel_labels[i], transform=axs[i].transAxes,fontsize=16, fontweight='bold', va='top', ha='right')
    axs.flatten()[0].set_ylabel('$I_{2}/I_{3}$')

    colorbar = fig.colorbar(scat[0], ax=axs, label=" Energy [kcal/mol]", location='left', anchor=(8.5,0))
    # fig.tight_layout()
fig.savefig(snakemake.output.all_cheminfo_comp_shape, dpi=600)
fig, axs = plt.subplots(1,2, figsize=(12,4))
if snakemake.wildcards.confgens != "0_0":
    colors = ['black', 'red',]
    axs[0].scatter(dihe_r[0][:,0], dihe_r[0][:,1], c=weights[0], cmap='Spectral_r', marker='.', s=0.5, vmin=0, vmax=8, rasterized=True)
    for i in range(confgen_number):
        axs[0].scatter(chem_info_dihe_r[i][:,0], chem_info_dihe_r[i][:,1], c=colors[i], marker='s', s=6, label=confgen_name[i].capitalize()) # markers
    #bbox_to_anchor=(2.05,0), loc='upper left')

    axs[0].set_xlabel("PC1")
    axs[0].set_ylabel("PC2")
    axs[0].text(-0.1, 1.15, all_panel_labels[0], transform=axs[0].transAxes,fontsize=16, fontweight='bold', va='top', ha='right')

    scat = axs[1].scatter(shape[0][:,0], shape[0][:,1], c=shape_weights[0], marker='.', cmap='Spectral_r', s=0.5, vmin=0, vmax=8, rasterized=True)

    for i in range(confgen_number):
        axs[1].scatter(chem_info_shapes[i][:,0], chem_info_shapes[i][:,1], c=colors[i], marker='.', s=4)
    # axs[1].set_xlabel(r'$I_{1}/I_{3}$')
    axs[1].triplot(trimesh,'--', color='grey')
    axs[1].triplot(outline,'k-')
    axs[1].text(0 ,1.01, 'rod', fontsize=SMALL_SIZE)
    axs[1].text(0.85 ,1.01, 'sphere', fontsize=SMALL_SIZE)
    axs[1].text(0.44 ,0.45, 'disk', fontsize=SMALL_SIZE)
    axs[1].scatter(0, 1.05,alpha=0, s=0.1)
    axs[1].scatter(1.05, 1.05,alpha=0, s=0.5)
    axs[1].scatter(0.5, 0.45,alpha=0, s=0.5)
    axs[1].text(-0.1, 1.15, all_panel_labels[1], transform=axs[1].transAxes,fontsize=16, fontweight='bold', va='top', ha='right')
    axs[1].axis('off')
    # axs[1].set_title(snakemake.wildcards[f"confgen{fig_to_plot+1}"])

    # axs[1].set_ylabel('$I_{2}/I_{3}$')
    axs[0].legend(mode='expand', ncol=2, loc='lower left', bbox_to_anchor=(-0.1, -0.3, 1.5, .102), borderaxespad=0)
    colorbar = fig.colorbar(scat, ax=axs, label="Energy [kcal/mol]", location='right')
fig.savefig(snakemake.output.single_comp_plot, bbox_inches='tight', dpi=600)
