Analysis Notebook
Contents
2.18. Analysis Notebook#
A copy of this notebook is run to analyse the molecular dynamics simulations. The type of MD simulation is specified in the Snakemake rule as a parameter, such that it is accessible via: snakemake.params.method.
There are various additional analysis steps, that are included in the notebook,
but are not part of the paper. To turn these on, set the beta_run parameter to True.
There are also some commented out lines in the notebook. These are mainly for the purpose of debugging. Some of them are for interactively exploring the 3d structure of the system. These don’t work as part of the automated snakemake workflow, but can be enabled when running a notebook interactively.
#Check if we should use shortened trajectories for analysis.
if snakemake.config["shortened"]:
    print("Using shortened trajectories and dihedrals. This only works if these were created previously!")
    if not (os.path.exists(snakemake.params.traj_short)
            and os.path.exists(snakemake.params.dihedrals_short)
            and os.path.exists(snakemake.params.dPCA_weights_MC_short)
            and os.path.exists(snakemake.params.weights_short)
           ):
        raise FileNotFoundError("Shortened trajectories and dihedrals files do not exist, but config value is set to use shortened files! Switch off the use of shortenend files and first analyse this simulation using the full trajectory!")
    else:
        use_shortened = True
else:
    use_shortened = False
# Imports
import matplotlib
import mdtraj as md
import numpy as np
import matplotlib.pyplot as plt
import matplotlib.tri as tri
import matplotlib.image as mpimg

# set matplotlib font sizes
SMALL_SIZE = 9
MEDIUM_SIZE = 11
BIGGER_SIZE = 13

plt.rc('font', size=MEDIUM_SIZE)          # controls default text sizes
plt.rc('axes', titlesize=BIGGER_SIZE)     # fontsize of the axes title
plt.rc('axes', labelsize=MEDIUM_SIZE)    # fontsize of the x and y labels
plt.rc('xtick', labelsize=SMALL_SIZE)    # fontsize of the tick labels
plt.rc('ytick', labelsize=SMALL_SIZE)    # fontsize of the tick labels
plt.rc('legend', fontsize=MEDIUM_SIZE)    # legend fontsize
plt.rc('figure', titlesize=BIGGER_SIZE)  # fontsize of the figure title

DPI = 600

import scipy.cluster.hierarchy
from scipy.spatial.distance import squareform
import pandas as pd

sys.path.append(os.getcwd())
import src.dihedrals
import src.pca
import src.noe
import src.Ring_Analysis
import src.stats
from src.pyreweight import reweight
from src.utils import json_load, pickle_dump
from sklearn.manifold import TSNE
from sklearn.cluster import DBSCAN
from sklearn.neighbors import NearestNeighbors
from sklearn.decomposition import PCA
import nglview as nv
from rdkit import Chem
from rdkit.Chem.Draw import IPythonConsole
import py_rdl
import seaborn as sns

IPythonConsole.molSize = (900, 300)  # (450, 150)
IPythonConsole.drawOptions.addStereoAnnotation = True
IPythonConsole.drawOptions.annotationFontScale = 1.5
import tempfile
import io
import svgutils.transform as sg
import svgutils.compose as sc
import scipy.stats as stats
from IPython.display import display, Markdown
# Can set a stride to make prelim. analysis faster. for production, use 1 (use all MD frames)
stride = int(snakemake.config["stride"])
print(f"Using stride {stride} to analyse MD simulations.")
# Perform additional analysis steps (e.g. compute structural digits)
beta_run = False

# Analysing compound
compound_index = int(snakemake.wildcards.compound_dir)
simtime = float(snakemake.wildcards.time)

# Storage for overview figure
final_figure_axs = []
Using stride 1 to analyse MD simulations.
2.18.1. Compound details#
display(Markdown(f"This notebook refers to compound {compound_index}."))

compound = json_load(snakemake.input.parm)
multi = compound.multi
if multi:
    display(Markdown(
        "According to the literature reference, there are two distinct structures in solution."
    ))
else:
    display(Markdown(
        "According to the literature reference, there is only one distinct structure in solution."
    ))
display(Markdown(f"""The sequence of the compound is **{compound.sequence}**. \n
A 2d structure of the compound is shown below."""))
This notebook refers to compound 55.
According to the literature reference, there is only one distinct structure in solution.
The sequence of the compound is cyclo-[Ser-Tyr-Ser-Met-Glu-His-Phe-Arg-Trp-Gly].
A 2d structure of the compound is shown below.
2.18.2. Simulation details#
# TODO: change notebook that it supports use of a shortened trajectory file
# only load protein topology
topo = md.load_frame(snakemake.input.traj, 0, top=snakemake.input.top)
protein = topo.topology.select("protein or resname ASH")
display(Markdown(f"The following atom numbers are part of the protein: {protein}"))
The following atom numbers are part of the protein: [ 0 1 2 3 4 5 6 7 8 9 10 11 12 13 14 15 16 17 18 19 20 21 22 23 24 25 26 27 28 29 30 31 32 33 34 35 36 37 38 39 40 41 42 43 44 45 46 47 48 49 50 51 52 53 54 55 56 57 58 59 60 61 62 63 64 65 66 67 68 69 70 71 72 73 74 75 76 77 78 79 80 81 82 83 84 85 86 87 88 89 90 91 92 93 94 95 96 97 98 99 100 101 102 103 104 105 106 107 108 109 110 111 112 113 114 115 116 117 118 119 120 121 122 123 124 125 126 127 128 129 130 131 132 133 134 135 136 137 138 139 140 141 142 143 144 145 146 147 148 149 150 151 152 153 154 155 156 157 158 159 160 161 162 163 164 165 166]
# Stereo check 1-frame trajectory to tmp-pdb file
t_stereo_check = topo.restrict_atoms(topo.topology.select("protein or resname ASH"))
tf = tempfile.NamedTemporaryFile(delete=False)
# tf.name
t_stereo_check.save_pdb(tf.name)

# Get reference mol
mol_ref = Chem.MolFromMol2File(
    snakemake.input.ref_mol,
    removeHs=False,
)

# Get 1st frame pdb from tempfile
post_eq_mol = Chem.MolFromPDBFile(
    tf.name,
    removeHs=False,
    sanitize=False,
)

# could compare smiles to automate the stereo-check. Problem: mol2 reference file has wrong bond orders
# (amber does not write those correctly). The ref-pdb file cannot be read b/c geometry is not optimized.
# This leads to funky valences in rdkit. The post-eq pdb file reads fine but then charges etc. dont match
# with the reference (b/c of wrong bond orders). But can manually check that all stereocentres are correct (below)
Chem.CanonSmiles(Chem.MolToSmiles(post_eq_mol)) == Chem.CanonSmiles(
    Chem.MolToSmiles(mol_ref)
)
display(Markdown("""Following we compare an annotated 2d structure of the compound's starting topology, with the
                 topology post equilibration"""))
Following we compare an annotated 2d structure of the compound's starting topology, with the topology post equilibration
post_eq_mol.RemoveAllConformers()
display(Markdown("2d structure of the compound post equilibration:"))
post_eq_mol
2d structure of the compound post equilibration:

mol_ref.RemoveAllConformers()
display(Markdown("2d structure of the compound reference topology:"))
mol_ref
2d structure of the compound reference topology:

# load trajectory
display(Markdown("Now we load the MD trajectory."))
if not use_shortened:
    t = md.load(
        snakemake.input.traj, top=snakemake.input.top, atom_indices=protein, stride=stride
    )  # added strideint for GaMD 2k
    print(t)
    # Remove solvent from trajectory
    t = t.restrict_atoms(t.topology.select("protein or resname ASH"))
    t = t.superpose(t, 0)

    # for GaMD, skip equlibration...
    if snakemake.params.method == "GaMD":
        weight_lengths = np.loadtxt(snakemake.input.weights)
        weight_lengths = int(len(weight_lengths))
        frames_start = int(t.n_frames - weight_lengths)
        t = t[int(frames_start / stride) :]  # added 13000 instead of 26000 for 2k
    else:
        frames_start = 0
    print(t)
else:
    stride = 1  # set stride to 1 for shortened files!
    t = md.load(
        snakemake.params.traj_short, top=snakemake.input.top, atom_indices=protein, stride=1
    )  # added strideint for GaMD 2k
    t = t.restrict_atoms(t.topology.select("protein or resname ASH"))
    t = t.superpose(t, 0)
Now we load the MD trajectory.
<mdtraj.Trajectory with 500000 frames, 167 atoms, 10 residues, and unitcells>
<mdtraj.Trajectory with 500000 frames, 167 atoms, 10 residues, and unitcells>
The simulation type is cMD, 2000 ns. The simulation was performed in H2O.
There are a total of 500000 frames available to analyse.
# Create a short trajectory & weights if working with the full trajectory
if not use_shortened:
    # determine stride to get 10k frames:
    stride_short = int(t.n_frames / 10000)
    if stride_short == 0:
        stride_short = 1

    # save short trajectory to file
    t[::stride_short].save_netcdf(snakemake.params.traj_short)

    # load weights for GaMD
    if snakemake.params.method != "cMD":
        weight_data = np.loadtxt(snakemake.input.weights)
        weight_data = weight_data[::stride]
        #create shortened weights
        np.savetxt(snakemake.params.weights_short, weight_data[::stride_short])
else:
    # load shortened weights for GaMD
    if snakemake.params.method != "cMD":
        weight_data = np.loadtxt(snakemake.params.weights_short)

# this determines a cutoff for when we consider cis/trans conformers separately.
# only relevant if 2 sets of NOE values present.
# t.n_frames / 1000 -> 0.1% of frames need to be cis/trans to consider both forms.
CIS_TRANS_CUTOFF = int(t.n_frames / 1000)
However, for some of the analysis steps below, only 1% of these frames have been used to ensure better rendering in the browser.
2.18.3. Convergence of the simulation#
2.18.3.1. RMSD#
To check for convergence of the simulation, we can look at the root mean squared deviation of the atomic positions over the course of the simulation.
# compute rmsd for different atom types
rmsds = md.rmsd(t, t, 0) * 10
bo = topo.topology.select("protein and (backbone and name O)")
ca = topo.topology.select("name CA")
rmsds_ca = md.rmsd(t, t, 0, atom_indices=ca) * 10  # Convert to Angstrom!
rmsds_bo = md.rmsd(t, t, 0, atom_indices=bo) * 10  # Convert to Angstrom!

rmsds = rmsds[::100]
rmsds_ca = rmsds_ca[::100]
rmsds_bo = rmsds_bo[::100]

# Create x data (simulation time)
x = [x / len(rmsds_ca) * simtime for x in range(0, len(rmsds_ca))]

# Make plot
fig = figure(
    plot_width=600,
    plot_height=400,
    title="RMSD of different atom types",
    x_axis_label="Simulation time in ns",
    y_axis_label="RMSD in angstrom, relative to first frame",
    sizing_mode="stretch_width",
    toolbar_location=None,
)
fig.line(
    x,
    rmsds,
    line_width=2,
    line_alpha=0.6,
    legend_label="all atoms",
    color="black",
    muted_alpha=0.1,
)
fig.line(
    x,
    rmsds_ca,
    line_width=2,
    line_alpha=0.6,
    legend_label="C-alpha atoms",
    color="blue",
    muted_alpha=0.1,
)
fig.line(
    x,
    rmsds_bo,
    line_width=2,
    line_alpha=0.6,
    legend_label="backbone O atoms",
    color="orange",
    muted_alpha=0.1,
)
fig.legend.click_policy = "mute"  #'hide'
show(fig)
# TODO: save rmsds as png, instead of manual screenshot https://docs.bokeh.org/en/latest/docs/user_guide/export.html
2.18.3.2. Dihedral angles#
if multi is not None:
    multi = {v: k for k, v in multi.items()}
    multiple = True
    distinction = compound.distinction
    print("Multiple compounds detected")
else:
    multiple = False
    pickle_dump(snakemake.output.multiple, multiple)
if multiple:  # if Compound.cistrans:
    ca_c = t.top.select(f"resid {distinction[0]} and name CA C")
    n_ca_next = t.top.select(f"resid {distinction[1]} and name N CA")
    omega = np.append(ca_c, n_ca_next)
    t_omega_rad = md.compute_dihedrals(t, [omega])
    t_omega_deg = np.abs(np.degrees(t_omega_rad))
    plt.plot(t_omega_deg)
    plt.hlines(90, 0, t.n_frames, color="red")
    plt.xlabel("Frames")
    plt.ylabel("Omega 0-1 [°]")
    plt.title(f"Dihedral angle over time. Compound {compound_index}")
    cis = np.where(t_omega_deg <= 90)[0]
    trans = np.where(t_omega_deg > 90)[0]
    pickle_dump(snakemake.output.multiple, (cis, trans))
    # t[trans]
# TODO: save dihedrals as png
resnames = []
for i in range(0, t.n_residues):
    resnames.append(t.topology.residue(i))

*_, omega = src.dihedrals.getDihedrals(t)
omega_deg = np.abs(np.degrees(omega))

omega_deg = omega_deg[::100]

simtime = float(snakemake.wildcards.time)

colors = src.utils.color_cycle()

# Create x data (simulation time)
x = [x / len(omega_deg) * simtime for x in range(0, len(omega_deg))]

# Make plot
fig = figure(
    plot_width=600,
    plot_height=400,
    title="Omega dihedral angles over time",
    x_axis_label="Simulation time in ns",
    y_axis_label="Dihedral angle in ˚",
    sizing_mode="stretch_width",
    toolbar_location=None,
)

for res, i, col in zip(resnames, range(len(resnames)), colors):
    fig.line(
        x,
        omega_deg[:, i],
        line_width=2,
        line_alpha=0.6,
        legend_label=str(res),
        color=col,
        muted_alpha=0.1,
    )

fig.legend.click_policy = "mute"  #'hide'
show(fig)
# Compute dihedral angles [Phi] [Psi] [Omega]
phi, psi, omega = src.dihedrals.getDihedrals(t)
if beta_run:
    # Print mean of dihedral angles [Phi] [Psi] [Omega]
    print(
        np.degrees(src.dihedrals.angle_mean(phi)),
        np.degrees(src.dihedrals.angle_mean(psi)),
        np.degrees(src.dihedrals.angle_mean(omega)),
    )
# Plot ramachandran plot for each amino acid
if beta_run:
    fig, axs = plt.subplots(int(np.ceil(len(phi.T) / 5)), 5, sharex="all", sharey="all")
    fig.set_size_inches(16, 4)
    motives = []
    i = 0
    for phi_i, psi_i in zip(np.degrees(phi.T), np.degrees(psi.T)):
        weights_phi_psi = reweight(
            np.column_stack((phi_i, psi_i)),
            None,
            "amdweight_MC",
            weight_data,
        )
        axs.flatten()[i].scatter(
            phi_i, psi_i, s=0.5, c=weights_phi_psi, vmin=0, vmax=8, cmap="Spectral_r"
        )
        axs.flatten()[i].set_title(i)
        motives.append(src.dihedrals.miao_ramachandran(phi_i, psi_i))
        i += 1
    fig.show()
if beta_run:
    # compute most common motives
    combined_motives = np.column_stack((motives))
    combined_motives = ["".join(test) for test in combined_motives]
    from collections import Counter

    c = Counter(combined_motives)
    motive_percentage = [
        (i, c[i] / len(combined_motives) * 100.0) for i, count in c.most_common()
    ]
    # 10 most common motives and percentage of frames
    print(motive_percentage[:10])
if beta_run:
    # Get indicies of most common motives
    combined_motives = np.array(combined_motives)
    idxs = []
    values = [i[0] for i in c.most_common(10)]
    for i, v in enumerate(values):
        idxs.append(np.where(combined_motives == v)[0])
2.18.4. Dimensionality Reductions#
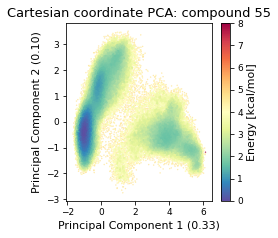
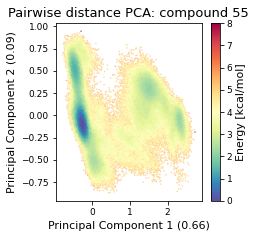
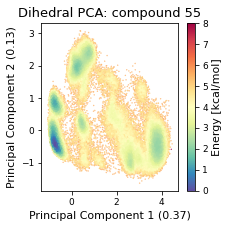
The simulation trajectories contain the positions of all atoms. This high dimensional data (3*N_atoms) is too complicated to analyse by itself. To get a feeling of the potential energy landscape we need to apply some kind of dimensionality reduction. Here, we apply the PCA (Principal Component Analysis) method.
2.18.4.1. Cartesian PCA#
Details about cartesian PCA
c_pca, reduced_cartesian = src.pca.make_PCA(t, "cartesian")

# reweighting:
if snakemake.params.method == "cMD":
    c_weights = reweight(reduced_cartesian, None, "noweight")
else:
    c_weights = reweight(
        reduced_cartesian, None, "amdweight_MC", weight_data
    )

if multiple:
    fig, axs = plt.subplots(1, 2, sharex="all", sharey="all", figsize=(6.7323, 3.2677))
    axs[0] = src.pca.plot_PCA(
        reduced_cartesian,
        "cartesian",
        compound_index,
        c_weights,
        "Energy [kcal/mol]",
        fig,
        axs[0],
        explained_variance=c_pca.explained_variance_ratio_[:2],
    )
    axs[1] = src.pca.plot_PCA_citra(
        reduced_cartesian[cis],
        reduced_cartesian[trans],
        "cartesian",
        compound_index,
        [multi["cis"] + " (cis)", multi["trans"] + " (trans)"],
        fig,
        axs[1],
    )

else:
    fig, ax = plt.subplots(figsize=(3.2677, 3.2677))
    ax = src.pca.plot_PCA(
        reduced_cartesian,
        "cartesian",
        compound_index,
        c_weights,
        "Energy [kcal/mol]",
        fig,
        ax,
        explained_variance=c_pca.explained_variance_ratio_[:2],
    )
2.18.4.2. Pairwise distances PCA#
pd_pca, reduced_pd = src.pca.make_PCA(t, "pairwise_N_O")

# reweighting:
if snakemake.params.method == "cMD":
    p_weights = reweight(reduced_pd, None, "noweight")
else:
    p_weights = reweight(
        reduced_pd, None, "amdweight_MC", weight_data
    )

if multiple:
    fig, axs = plt.subplots(1, 2, sharex="all", sharey="all", figsize=(6.7323, 3.2677))
    axs[0] = src.pca.plot_PCA(
        reduced_pd,
        "pairwise",
        compound_index,
        p_weights,
        "Energy [kcal/mol]",
        fig,
        axs[0],
        explained_variance=pd_pca.explained_variance_ratio_[:2],
    )
    axs[1] = src.pca.plot_PCA_citra(
        reduced_pd[cis],
        reduced_pd[trans],
        "pairwise",
        compound_index,
        [multi["cis"] + " (cis)", multi["trans"] + " (trans)"],
        fig,
        axs[1],
    )
else:
    fig, ax = plt.subplots(figsize=(3.2677, 3.2677))
    ax = src.pca.plot_PCA(
        reduced_pd,
        "pairwise",
        compound_index,
        p_weights,
        "Energy [kcal/mol]",
        fig,
        ax,
        explained_variance=pd_pca.explained_variance_ratio_[:2],
    )
2.18.4.3. Dihedral PCA#
pca_d, reduced_dihedrals = src.pca.make_PCA(t, "dihedral")
reduced_dihedrals_full = src.dihedrals.getReducedDihedrals(t)

# save pca object & reduced dihedrals
pickle_dump(snakemake.output.dPCA, pca_d)
pickle_dump(snakemake.output.dihedrals, reduced_dihedrals_full)
if not use_shortened:
    pickle_dump(snakemake.params.dihedrals_short, reduced_dihedrals_full[::stride_short])

# reweighting:
if snakemake.params.method == "cMD":
    d_weights = reweight(reduced_dihedrals, None, "noweight")
else:
    d_weights = reweight(
        reduced_dihedrals, None, "amdweight_MC", weight_data
    )
if multiple:
    fig, axs = plt.subplots(1, 2, sharex="all", sharey="all", figsize=(6.7323, 3.2677))
    axs[0] = src.pca.plot_PCA(
        reduced_dihedrals,
        "dihedral",
        compound_index,
        d_weights,
        "Energy [kcal/mol]",
        fig,
        axs[0],
        explained_variance=pca_d.explained_variance_ratio_[:2],
    )
    axs[1] = src.pca.plot_PCA_citra(
        reduced_dihedrals[cis],
        reduced_dihedrals[trans],
        "dihedral",
        compound_index,
        [multi["cis"] + " (cis)", multi["trans"] + " (trans)"],
        fig,
        axs[1],
    )
    fig.savefig(snakemake.output.pca_dihe, dpi=DPI)
else:
    fig, ax = plt.subplots(figsize=(3.2677, 3.2677))
    ax = src.pca.plot_PCA(
        reduced_dihedrals,
        "dihedral",
        compound_index,
        d_weights,
        "Energy [kcal/mol]",
        fig,
        ax,
        explained_variance=pca_d.explained_variance_ratio_[:2],
    )
    fig.tight_layout()
    fig.savefig(snakemake.output.pca_dihe, dpi=DPI)
final_figure_axs.append(sg.from_mpl(fig, savefig_kw={"dpi": DPI}))
pickle_dump(snakemake.output.dPCA_weights_MC, d_weights)
if not use_shortened:
    pickle_dump(snakemake.params.dPCA_weights_MC_short, d_weights[::stride_short])
if beta_run:
    # Plot structural digits on top of dPCA
    fig, axs = plt.subplots(2, 5, sharex="all", sharey="all")
    fig.set_size_inches(12, 8)
    for i in range(10):
        axs.flatten()[i] = src.pca.plot_PCA(
            reduced_dihedrals,
            "dihedral",
            compound_index,
            d_weights,
            "Energy [kcal/mol]",
            fig,
            axs.flatten()[i],
            cbar_plot="nocbar",
            explained_variance=pca_d.explained_variance_ratio_[:2],
        )
        axs.flatten()[i].scatter(
            reduced_dihedrals[idxs[i]][:, 0],
            reduced_dihedrals[idxs[i]][:, 1],
            label=values[i],
            s=0.2,
            marker=".",
            color="black",
        )
        axs.flatten()[i].set_title(f"{values[i]}: {motive_percentage[i][1]:.2f}%")
    fig.tight_layout()
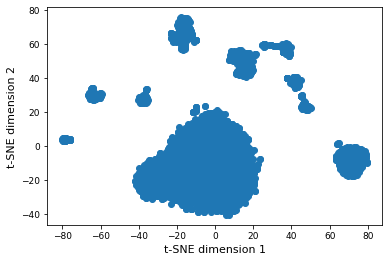
2.18.4.4. TSNE#
# TSNE dimensionality reduction
# TSNE
if not use_shortened:
    plot_stride = 100
else:
    plot_stride = 1
cluster_stride = plot_stride  # 125 previously
dihe = src.dihedrals.getReducedDihedrals(t)
tsne = TSNE(n_components=2, verbose=0, perplexity=50, n_iter=2000, random_state=42)
tsne_results = tsne.fit_transform(dihe[::cluster_stride, :])  # 250
plt.scatter(tsne_results[:, 0], tsne_results[:, 1])
plt.xlabel("t-SNE dimension 1")
plt.ylabel("t-SNE dimension 2")
plt.show()
/biggin/b147/univ4859/research/snakemake_conda/b998fbb8f687250126238eb7f5e2e52c/lib/python3.7/site-packages/sklearn/manifold/_t_sne.py:783: FutureWarning: The default initialization in TSNE will change from 'random' to 'pca' in 1.2.
  FutureWarning,
/biggin/b147/univ4859/research/snakemake_conda/b998fbb8f687250126238eb7f5e2e52c/lib/python3.7/site-packages/sklearn/manifold/_t_sne.py:793: FutureWarning: The default learning rate in TSNE will change from 200.0 to 'auto' in 1.2.
  FutureWarning,
2.18.4.5. Shape analysis - principal moments of inertia#
inertia_tensor = md.compute_inertia_tensor(t)
principal_moments = np.linalg.eigvalsh(inertia_tensor)

# Compute normalized principal moments of inertia
npr1 = principal_moments[:, 0] / principal_moments[:, 2]
npr2 = principal_moments[:, 1] / principal_moments[:, 2]
mol_shape = np.stack((npr1, npr2), axis=1)

# Reweighting
if snakemake.params.method == "cMD":
    mol_shape_weights = reweight(mol_shape, None, "noweight")
else:
    mol_shape_weights = reweight(
        mol_shape, None, "amdweight_MC", weight_data
    )

# save
pickle_dump(snakemake.output.NPR_shape_data, mol_shape)
pickle_dump(snakemake.output.NPR_shape_weights, mol_shape_weights)
# Plot
x = mol_shape[:, 0]
y = mol_shape[:, 1]
v = mol_shape_weights
# create a triangulation out of these points
T = tri.Triangulation(x, y)

fig, ax = plt.subplots(figsize=(3.2677, 3.2677))

# plot the contour
# plt.tricontourf(x,y,T.triangles,v)
scat = ax.scatter(
    mol_shape[:, 0],
    mol_shape[:, 1],
    s=0.5,
    c=mol_shape_weights,
    cmap="Spectral_r",
    vmin=0,
    vmax=8,
    rasterized=True,
)

# create the grid
corners = np.array([[1, 1], [0.5, 0.5], [0, 1]])
triangle = tri.Triangulation(corners[:, 0], corners[:, 1])

# creating the outline
refiner = tri.UniformTriRefiner(triangle)
outline = refiner.refine_triangulation(subdiv=0)

# creating the outline
refiner = tri.UniformTriRefiner(triangle)
trimesh = refiner.refine_triangulation(subdiv=2)

# plotting the mesh
ax.triplot(trimesh, "--", color="grey")
ax.triplot(outline, "k-")
ax.set_xlabel(r"$I_{1}/I_{3}$")
ax.set_ylabel("$I_{2}/I_{3}$")
ax.text(0, 1.01, "rod")
ax.text(0.75, 1.01, "sphere")
ax.text(0.52, 0.48, "disk")
ax.set_ylim(0.45, 1.05)  # 0.6
ax.set_xlim(-0.05, 1.08) # 1.13
ax.set_aspect(1.88)  # 1.13 / 0.6
ax.set_title('Shape analysis')

colorbar = fig.colorbar(scat, label="Energy [kcal/mol]", fraction=0.046, pad=0.04)

fig.tight_layout()
fig.savefig(snakemake.output.NPR_shape_plot, dpi=DPI)
# final_figure_axs.append(sg.from_mpl(fig, savefig_kw={"dpi": DPI}))
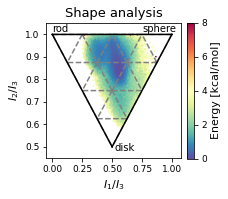
2.18.4.6. Cremer pople analysis#
# load topology reference
# mol_ref = Chem.MolFromPDBFile(pdb_amber, removeHs=False, proximityBonding=True) #removeHs=True, proximityBonding=True)
mol_ref = Chem.MolFromMol2File(
    snakemake.input.ref_mol,
    removeHs=False,
)
mol_ref.RemoveAllConformers()
display(Markdown("Topology Reference:"))
mol_ref
Topology Reference:

mol_ref.GetNumAtoms() == t.n_atoms
True
# Get Bond Set
bonds = []
for bond in mol_ref.GetBonds():
    bonds.append((bond.GetBeginAtom().GetIdx(), bond.GetEndAtom().GetIdx()))

cremerpople_store = []

data = py_rdl.Calculator.get_calculated_result(bonds)

ring_length = []
for urf in data.urfs:
    rcs = data.get_relevant_cycles_for_urf(urf)
    for rc in rcs:
        ring_length.append(
            len(src.Ring_Analysis.Rearrangement(mol_ref, list(rc.nodes)))
        )
max_ring = ring_length.index(max(ring_length))

# for urf in data.urfs:
urf = data.urfs[max_ring]
rcs = data.get_relevant_cycles_for_urf(urf)
for rc in rcs:
    ringloop = src.Ring_Analysis.Rearrangement(
        mol_ref, list(rc.nodes)
    )  # rearrange the ring atom order
    # src.Ring_Analysis.CTPOrder(mol_ref, list(rc.nodes), n_res=t.n_residues) ## this does not work...
    coord = t.xyz[:, ringloop]
    for i in range(t.n_frames):
        ccoord = src.Ring_Analysis.Translate(coord[i])
        qs, angle = src.Ring_Analysis.GetRingPuckerCoords(
            ccoord
        )  # get cremer-pople parameters
        qs.extend([abs(x) for x in angle])
        cremerpople_store.append(qs)  # flatten tuple/list to just 1d list...
        # coord = np.array([mol0.GetConformer(1).GetAtomPosition(atom) for atom in ringloop]) # get current ring atom coordinates
        # ccoord = RA.Translate(coord) # translate ring with origin as cetner
        # cremerpople = RA.GetRingPuckerCoords(ccoord) # get cremer-pople parameters

cremerpople_store = np.array(cremerpople_store)
# from sklearn.preprocessing import normalize

pca = PCA(n_components=2)
pca_input = cremerpople_store.reshape(t.n_frames, len(qs))
# normalize(cremerpople_store.reshape(t.n_frames, len(qs)))

cp_reduced_output = pca.fit_transform(pca_input)

if snakemake.params.method == "cMD":
    cp_weights = reweight(cp_reduced_output, None, "noweight")
else:
    cp_weights = reweight(
        cp_reduced_output, None, "amdweight_MC", weight_data
    )

ax = src.pca.plot_PCA(
    cp_reduced_output,
    "CP",
    compound_index,
    cp_weights,
    explained_variance=pca.explained_variance_ratio_[:2],
)

if multiple:
    src.pca.plot_PCA_citra(
        cp_reduced_output[cis],
        cp_reduced_output[trans],
        "CP",
        compound_index,
        label=None,
        fig=None,
        ax=None,
    )
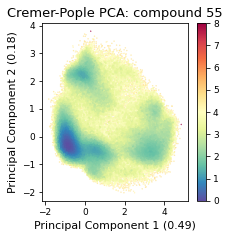
2.18.4.7. Comparison#
# produce a shared datasource with shared labels
if not use_shortened:
    plot_stride = 100
else:
    plot_stride = 1
reduced_dihedrals_t = reduced_dihedrals[::plot_stride]
reduced_pd_t = reduced_pd[::plot_stride]
mol_shape_t = mol_shape[::plot_stride]

# Either show cremer pople, or show shapes
show_cremer_pople = False

if show_cremer_pople:
    crepop_t = cp_reduced_output[::plot_stride]
    tmp_dict = {
        "dh_pc1": reduced_dihedrals_t[:, 0],
        "dh_pc2": reduced_dihedrals_t[:, 1],
        "pd_pc1": reduced_pd_t[:, 0],
        "pd_pc2": reduced_pd_t[:, 1],
        "tsne1": tsne_results[:, 0],
        "tsne2": tsne_results[:, 1],
        "cp1": crepop_t[:, 0],
        "cp2": crepop_t[:, 1],
    }
else:
    tmp_dict = {
        "dh_pc1": reduced_dihedrals_t[:, 0],
        "dh_pc2": reduced_dihedrals_t[:, 1],
        "pd_pc1": reduced_pd_t[:, 0],
        "pd_pc2": reduced_pd_t[:, 1],
        "tsne1": tsne_results[:, 0],
        "tsne2": tsne_results[:, 1],
        "npr1": mol_shape_t[:, 0],
        "npr2": mol_shape_t[:, 1],
    }
df = pd.DataFrame(tmp_dict)
source = ColumnDataSource(data=df)
# Linked plots in different representations
from bokeh.io import output_file, show
from bokeh.layouts import gridplot
from bokeh.models import ColumnDataSource, Label, LabelSet
from bokeh.plotting import figure
from bokeh.models import BooleanFilter, CDSView

TOOLS = "box_select,lasso_select,reset"

# create a new plot and add a renderer
left = figure(tools=TOOLS, plot_width=300, plot_height=300, title="Dihedral PCA")
left.dot("dh_pc1", "dh_pc2", source=source, selection_color="firebrick")

# create another new plot, add a renderer that uses the view of the data source
right = figure(
    tools=TOOLS, plot_width=300, plot_height=300, title="Pairwise NO distances"
)
right.dot("pd_pc1", "pd_pc2", source=source, selection_color="firebrick")

rightr = figure(
    tools=TOOLS, plot_width=300, plot_height=300, title="TSNE (of dihedral angles)"
)
rightr.dot("tsne1", "tsne2", source=source, selection_color="firebrick")

if show_cremer_pople:
    rightrr = figure(tools=TOOLS, plot_width=300, plot_height=300, title="Cremer-Pople")
    rightrr.dot("cp1", "cp2", source=source, selection_color="firebrick")
else:
    rightrr = figure(tools=TOOLS, plot_width=300, plot_height=300, title="PMI")
    rightrr.dot("npr1", "npr2", source=source, selection_color="firebrick")
    rightrr.line([0.5, 0, 1, 0.5], [0.5, 1, 1, 0.5], line_width=2, color="black")
    rightrr.line(
        [0.45, -0.05, 1.05, 0.45],
        [0.4, 1.1, 1.1, 0.4],
        line_width=2,
        color="white",
        line_alpha=0,
    )

    triangle = ColumnDataSource(
        data=dict(x=[0, 0.83, 0.44], y=[1, 1, 0.45], names=["rod", "sphere", "disk"])
    )

    labels = LabelSet(
        x="x",
        y="y",
        text="names",
        x_offset=0,
        y_offset=0,
        source=triangle,
        render_mode="canvas",
    )

    rightrr.add_layout(labels)

p = gridplot([[left, right, rightr, rightrr]], sizing_mode="stretch_width")
show(p)
2.18.5. DBSCAN-Clustering#
The following section provides details about the performed DBSCAN clustering. Detailed plots about parameter derivation for the clustering are hidden, but can be revealed.
# Derive epsilon for DBSCAN-clustering from data: epsilon = max distance between nearest neighbors
nbrs = NearestNeighbors(n_neighbors=2).fit(tsne_results)
distances, indices = nbrs.kneighbors(tsne_results)
epsilon = distances.max()
distances = np.sort(distances, axis=0)
distances = distances[:, 1]
plt.plot(distances)
plt.title("NN-distances in tsne plot")
plt.ylabel("NN-distance")
plt.show()
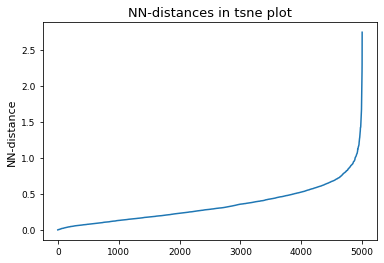
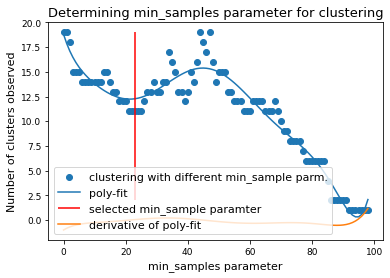
# Perform DBSCAN-clustering with varying min_samples parameter
num_clusters = []
num_noise = []
for i in range(0, 200, 1):
    clustering = DBSCAN(eps=epsilon, min_samples=i).fit(tsne_results)
    labels = clustering.labels_
    n_clusters = len(set(labels)) - (1 if -1 in labels else 0)
    n_noise = list(labels).count(-1)
    num_clusters.append(n_clusters)
    num_noise.append(n_noise)

# Drop all points following the first detection of 0 clusters
num_clusters = np.array(num_clusters)
cutoff = np.argmin(num_clusters > 0)
num_clusters = num_clusters[:cutoff]
# print(num_clusters)

x = np.arange(0, len(num_clusters))
# Fit polynomial to detect right-most plateau
if x.size > 0:
    mymodel = np.poly1d(np.polyfit(x, num_clusters, 8))

    deriv = mymodel.deriv()
    roots = deriv.roots

    # discard complex roots
    r_roots = roots[np.isreal(roots)].real

    # discard negative values
    r_roots = r_roots[r_roots >= 0]

    # discard values greater than x.max()
    r_roots = r_roots[r_roots <= x.max() - 3]

    # Take largest root
    if r_roots != []:
        min_samples = int(r_roots.max())
        print(f"min_samples = {min_samples} was selected as parameter for clustering")
    else:
        min_samples = 15
        print(
            "Caution! min samples parameter was selected as fixed value b/c automatic determination failed. specify the parameter manually in the config!"
        )
else:
    min_samples = 15
# If config overrides, use config value:
if snakemake.wildcards.index in snakemake.config["cluster_conf"]:
    min_samples = int(snakemake.config["cluster_conf"][snakemake.wildcards.index])
    print(
        f"Override: Use min_samples={min_samples} instead of the above determined parameter"
    )
min_samples = 94 was selected as parameter for clustering
/biggin/b147/univ4859/research/snakemake_conda/b998fbb8f687250126238eb7f5e2e52c/lib/python3.7/site-packages/ipykernel_launcher.py:18: DeprecationWarning: elementwise comparison failed; this will raise an error in the future.
# Alternative: determine min_samples parameter by deciding for a fix fraction of points to classify as noise
# set cutoff as threshold percent of noise
threshhold = 0.05
num_noise = np.array(num_noise)
min_samples = np.argmin(num_noise < len(tsne_results) * threshhold)
# noise_cutoff
# min_samples = 8
display(f"Override: Use min_samples={min_samples} instead of the above determined parameter")
'Override: Use min_samples=23 instead of the above determined parameter'
plt.scatter(x, num_clusters, label="clustering with different min_sample parm.")
if x.size > 0:
    plt.plot(x, mymodel(x), label="poly-fit")
    plt.vlines(
        min_samples,
        2,
        num_clusters.max(),
        color="red",
        label="selected min_sample paramter",
    )
    plt.plot(x, deriv(x), label="derivative of poly-fit")
plt.legend(loc="lower left")
plt.title("Determining min_samples parameter for clustering")
plt.xlabel("min_samples parameter")
plt.ylabel("Number of clusters observed")
plt.savefig(snakemake.output.cluster_min_samp, dpi=DPI)
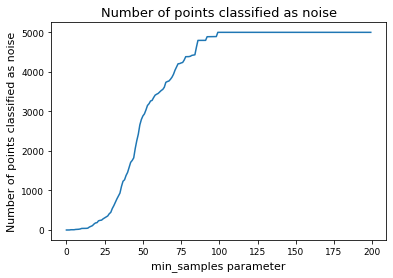
plt.plot(num_noise, label="Number of points classified as noise")
plt.xlabel("min_samples parameter")
plt.ylabel("Number of points classified as noise")
plt.title("Number of points classified as noise")
plt.show()
# Perform clustering for selected min_samples parameter
clustering = DBSCAN(eps=epsilon, min_samples=min_samples).fit(tsne_results)

threshhold = 0.01  # 0.05

n_clusters = len(set(clustering.labels_)) - (1 if -1 in clustering.labels_ else 0)
print(f"There are {n_clusters} clusters")

cluster_points = []
cluster_label_filter = []
cluster_percentage = []

cluster_labels_sorted_by_population = list(dict.fromkeys(sorted(clustering.labels_, key=list(clustering.labels_).count, reverse=True)))

plt.figure(figsize=(3.2677, 3.2677))
for cluster in cluster_labels_sorted_by_population:
    if cluster != -1:
        if len(clustering.labels_[clustering.labels_ == cluster]) >= threshhold * len(
            clustering.labels_
        ):
            clus_points = tsne_results[clustering.labels_ == cluster]
            plt.plot(
                clus_points[:, 0],
                clus_points[:, 1],
                marker=".",
                linewidth=0,
                label=f"Cluster {cluster}",
            )
            percentage = len(clustering.labels_[clustering.labels_ == cluster]) / len(
                clustering.labels_
            )
            plt.text(
                x=np.mean(clus_points[:, 0]),
                y=np.mean(clus_points[:, 1]),
                s=f"{cluster}: {percentage*100:0.2f}%",
                verticalalignment="center",
                horizontalalignment="center",
            )
            print(
                f"Cluster {cluster} makes up more than {threshhold * 100}% of points. ({percentage * 100:0.2f} % of total points)"
            )
            cluster_percentage.append(percentage)
            cluster_points.append(clustering.labels_ == cluster)
            cluster_label_filter.append(cluster)
        else:
            clus_points = tsne_results[clustering.labels_ == cluster]
            plt.plot(
                clus_points[:, 0],
                clus_points[:, 1],
                marker=".",
                linewidth=0,
                label=f"Cluster {cluster}",
                alpha=0.1,
            )
            percentage = len(clustering.labels_[clustering.labels_ == cluster]) / len(
                clustering.labels_
            )
            print(
                f"Exlude Cluster {cluster} is less than {threshhold*100}% of points. ({percentage * 100:0.2f} % of total points)"
            )
            plt.plot
    else:
        clus_points = tsne_results[clustering.labels_ == cluster]
        plt.plot(
            clus_points[:, 0],
            clus_points[:, 1],
            marker=".",
            linewidth=0,
            label=f"Noise",
            alpha=0.1,
            color="grey",
        )

        percentage = len(clustering.labels_[clustering.labels_ == cluster]) / len(
            clustering.labels_
        )
        print(f"Noise makes up {percentage * 100:0.2f} % of total points.")

# Shrink current axis by 20%

# plt.legend(loc="center right", bbox_to_anchor=(1.3,0.25))
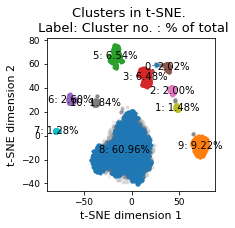
plt.title(f"Clusters in t-SNE. \n Label: Cluster no. : % of total")
plt.xlabel("t-SNE dimension 1")
plt.ylabel("t-SNE dimension 2")
plt.tight_layout()
plt.savefig(snakemake.output.cluster_plot, dpi=DPI)
There are 11 clusters
Cluster 8 makes up more than 1.0% of points. (60.96 % of total points)
Cluster 9 makes up more than 1.0% of points. (9.22 % of total points)
Cluster 5 makes up more than 1.0% of points. (6.54 % of total points)
Cluster 3 makes up more than 1.0% of points. (6.48 % of total points)
Noise makes up 5.00 % of total points.
Cluster 6 makes up more than 1.0% of points. (2.60 % of total points)
Cluster 0 makes up more than 1.0% of points. (2.02 % of total points)
Cluster 2 makes up more than 1.0% of points. (2.00 % of total points)
Cluster 10 makes up more than 1.0% of points. (1.84 % of total points)
Cluster 1 makes up more than 1.0% of points. (1.48 % of total points)
Cluster 7 makes up more than 1.0% of points. (1.28 % of total points)
Exlude Cluster 4 is less than 1.0% of points. (0.58 % of total points)
plt.figure(figsize=(3.2677, 3.2677))
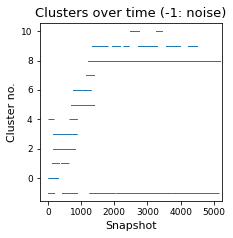
plt.plot(clustering.labels_, marker=1, linewidth=0)
plt.title("Clusters over time (-1: noise)")
plt.xlabel("Snapshot")
plt.ylabel("Cluster no.")
plt.savefig(snakemake.output.cluster_time, dpi=DPI)
# Find cluster points in original trajectory, compute average structure,
# then find closest (min-rmsd) cluster structure to this
reduced_ind = np.arange(0, len(dihe), cluster_stride)
reduced_g_dihe = dihe[reduced_ind, :]
cluster_min_pca = []
cluster_index = []
mol_shape_cluster = []

t0 = t[0].time
dt = t.timestep

for i, cluster_name in zip(cluster_points, cluster_label_filter):

    # cluster points in original trajectory
    indices = reduced_ind[i]
    avg_struct = np.mean(t[indices].xyz, axis=0)
    avg_t = md.Trajectory(xyz=avg_struct, topology=None)

    # compute average dihedral angles for each cluster:
    phi, psi, omega = src.dihedrals.getDihedrals(t[indices])
    print(
        np.degrees(src.dihedrals.angle_mean(phi)),
        np.degrees(src.dihedrals.angle_mean(psi)),
        np.degrees(src.dihedrals.angle_mean(omega)),
    )

    # find min-RMSD structure to the average
    rmsd = md.rmsd(t[indices], avg_t, 0)
    min_rmsd_idx = np.where(rmsd == rmsd.min())
    cluster_min = t[indices][min_rmsd_idx]
    cluster_index.append(int((cluster_min.time - t0) / dt))
    print(
        f"Cluster {cluster_name}: Closest min structure is frame {int((cluster_min.time - t0) / dt)} (time: {float(cluster_min.time)})"
    )
    # Compute dihedrals of min-RMSD cluster structure, and transform to PCA
    cluster_min = src.dihedrals.getReducedDihedrals(cluster_min)
    cluster_min_pca.append(pca_d.transform(cluster_min))

    # Compute shape
    inertia_tensor_cluster = md.compute_inertia_tensor(t[indices][min_rmsd_idx])
    principal_moments_cluster = np.linalg.eigvalsh(inertia_tensor_cluster)

    # Compute normalized principal moments of inertia
    npr1_cluster = principal_moments_cluster[:, 0] / principal_moments_cluster[:, 2]
    npr2_cluster = principal_moments_cluster[:, 1] / principal_moments_cluster[:, 2]
    mol_shape_cluster.append(np.stack((npr1_cluster, npr2_cluster), axis=1))
[-84.75716  -63.627285 -73.02558  -74.55706  -81.78632  -70.338585
 -97.66672   50.296906 -91.53322   74.10974 ] [ 159.90309   137.01344   129.48201   147.90927   152.38626   130.10117
  118.36349    32.577766  138.85825  -158.86584 ] [ 179.87764    -7.71905  -169.50665   167.56305  -178.04164    -8.232163
  175.43834  -176.31015   175.71352   176.0637  ]
Cluster 8: Closest min structure is frame 302800 (time: 1211204.0)
[-156.45673    49.954563  -96.20347   -74.4588   -108.26981   -71.80385
  -93.86802    49.752804  -99.97811    68.84982 ] [ 151.63608    61.614414  153.23637   137.43077   154.9597    132.38902
  116.37981    32.54604   134.19261  -163.81989 ] [ 178.42381      2.1794312  171.29152    178.59454   -179.52397
   -7.8725014  173.23174   -177.46408    179.9704     179.13504  ]
Cluster 9: Closest min structure is frame 137600 (time: 550404.0)
[ -91.98943   -93.97892   -71.96985   -65.75192  -119.10294   -75.028145
  -94.59815    48.348022  -71.59947   -79.45586 ] [154.69284   127.57547   147.92177   132.68872   153.96405   134.51202
 119.68964    34.403816  135.13393     6.8100896] [ 177.77771    -8.203814 -174.33879  -178.2819    178.38316    -4.619821
  172.12083   176.00893  -172.52142   176.95128 ]
Cluster 5: Closest min structure is frame 87600 (time: 350404.0)
[ -71.07074  -138.85138   -70.17304   -77.29064   -85.61531   -73.049095
  -76.629105  -98.750404 -100.16572  -153.1834  ] [ -24.871363  142.53256   163.98184    -8.443786  147.04597   141.75153
  135.929     128.42827   -21.550047 -156.85335 ] [ 175.10274     -5.9531035  177.20335    179.75243    178.4019
   -6.157481  -178.79521    175.7011     178.65392    178.74965  ]
Cluster 3: Closest min structure is frame 59200 (time: 236804.0)
[ -83.36939   -67.98524  -128.03122    54.148964  -70.04394   -80.427795
  -97.93627    52.764683  -73.2204    -76.322975] [149.48488   127.75357   126.75716    37.961624  140.22507   135.09747
 118.07473    28.34854   145.37762    -1.5197138] [ 179.21681     -5.156928  -178.71419   -175.40947   -177.5962
   -6.0696683  173.92291   -179.20447    179.68913    176.6211   ]
Cluster 6: Closest min structure is frame 78900 (time: 315604.0)
[ -74.32168  -139.74702   -72.497154  -73.341545 -151.1047     52.131973
 -117.31278   -74.31441   -83.30624   166.66577 ] [ -23.991602  138.43661   158.17876   -29.196697  151.98326    61.15769
  156.97542    72.36722   -16.085978 -133.66158 ] [ 174.20532    -12.507578   176.48962    177.43225    179.43445
    2.9051926  177.79832    176.7218    -179.80324    174.5969   ]
Cluster 0: Closest min structure is frame 7200 (time: 28804.0)
[ -91.30137  -146.70618   -77.26593   -78.99814   -82.44457   -71.410835
  -75.87245   -89.629135 -133.56523    63.595547] [ -17.804083  140.0576    162.60454   -10.524234  146.96118   139.57582
  133.68318   135.84843   133.7056   -143.35042 ] [-178.49118     -2.7937713  174.24487    176.71237   -179.12161
   -4.8460507 -173.7945     173.2425    -177.78722    175.8976   ]
Cluster 2: Closest min structure is frame 29100 (time: 116404.0)
[-149.48004  -141.28633   -79.97241   -82.70294  -116.42628   -71.25622
  -95.97902    53.3064    -87.371796   71.79842 ] [ -34.68845   87.79657  154.39667  136.40181  154.01566  132.5096
  115.40567   27.37383  131.2326  -160.19798] [-177.73308     -6.88222    173.68149    176.84044   -179.06316
   -7.8584414  174.22192    178.99255   -176.53296    179.99748  ]
Cluster 10: Closest min structure is frame 254200 (time: 1016804.0)
[ -66.281105 -118.47839   -71.6024    -65.99772  -131.70728  -158.05847
  -83.54294   -91.24202   -80.34198  -173.20813 ] [ -21.495575  151.15318   167.26643   -26.82614   -53.614143  133.67143
  142.08446    84.69476   -16.72977  -126.92789 ] [ 173.02715   -10.124522 -179.61116   178.81355  -179.08873    -8.310289
 -178.96478   174.61569   176.31772   168.20982 ]
Cluster 1: Closest min structure is frame 12500 (time: 50004.0)
[ -89.979294   48.789425  -71.09423   -59.584682 -110.96383   -72.13509
  -93.66041    53.65587   -73.89098   -75.39108 ] [ -9.105728  81.880775 156.01358  137.08675  152.2204   132.20311
 115.434235  23.598951 131.88463   58.779766] [ 179.84521      2.0693152 -178.6997     178.1921    -178.49452
   -6.7052283  173.16774    177.35776   -177.91458   -170.53586  ]
Cluster 7: Closest min structure is frame 114800 (time: 459204.0)
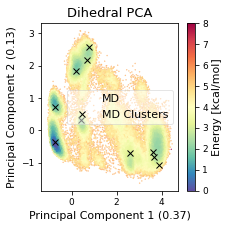
# Plot cluster mins in original d-PCA plot
fig, ax = plt.subplots(figsize=(3.2677, 3.2677))
ax = src.pca.plot_PCA(
    reduced_dihedrals,
    "dihedral",
    compound_index,
    d_weights,
    "Energy [kcal/mol]",
    fig,
    ax,
    explained_variance=pca_d.explained_variance_ratio_[:2],
)
# ADD LEGEND ENTRY FOR MD
ax.plot(
    np.array(cluster_min_pca)[:, 0, 0],
    np.array(cluster_min_pca)[:, 0, 1],
    label="Clusters",
    linewidth=0,
    marker="x",
    c='black',
)

ax.legend(["MD","MD Clusters"], framealpha=0.5)

fig.tight_layout()

ax.set_title("Dihedral PCA")
fig.savefig(snakemake.output.cluster_pca, dpi=DPI)
final_figure_axs.append(sg.from_mpl(fig, savefig_kw={"dpi": DPI}))
/biggin/b147/univ4859/research/snakemake_conda/b998fbb8f687250126238eb7f5e2e52c/lib/python3.7/site-packages/ipykernel_launcher.py:25: UserWarning: Creating legend with loc="best" can be slow with large amounts of data.
/biggin/b147/univ4859/research/snakemake_conda/b998fbb8f687250126238eb7f5e2e52c/lib/python3.7/site-packages/ipykernel_launcher.py:28: UserWarning: Creating legend with loc="best" can be slow with large amounts of data.
/biggin/b147/univ4859/research/snakemake_conda/b998fbb8f687250126238eb7f5e2e52c/lib/python3.7/site-packages/svgutils/transform.py:425: UserWarning: Creating legend with loc="best" can be slow with large amounts of data.
  fig.savefig(fid, format="svg", **savefig_kw)
/biggin/b147/univ4859/research/snakemake_conda/b998fbb8f687250126238eb7f5e2e52c/lib/python3.7/site-packages/IPython/core/pylabtools.py:151: UserWarning: Creating legend with loc="best" can be slow with large amounts of data.
  fig.canvas.print_figure(bytes_io, **kw)
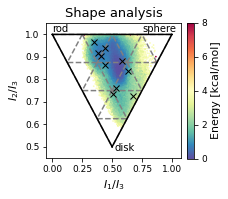
# Plot cluster mins in shape plot
# Plot
x = mol_shape[:, 0]
y = mol_shape[:, 1]
v = mol_shape_weights
# create a triangulation out of these points
T = tri.Triangulation(x, y)

fig, ax = plt.subplots(figsize=(3.2677, 3.2677))

# plot the contour
# plt.tricontourf(x,y,T.triangles,v)
scat = ax.scatter(
    mol_shape[:, 0],
    mol_shape[:, 1],
    s=0.5,
    c=mol_shape_weights,
    cmap="Spectral_r",
    vmin=0,
    vmax=8,
    rasterized=True,
)

# create the grid
corners = np.array([[1, 1], [0.5, 0.5], [0, 1]])
triangle = tri.Triangulation(corners[:, 0], corners[:, 1])

# creating the outline
refiner = tri.UniformTriRefiner(triangle)
outline = refiner.refine_triangulation(subdiv=0)

# creating the outline
refiner = tri.UniformTriRefiner(triangle)
trimesh = refiner.refine_triangulation(subdiv=2)

# plotting the mesh
ax.triplot(trimesh, "--", color="grey")
ax.triplot(outline, "k-")
ax.set_xlabel(r"$I_{1}/I_{3}$")
ax.set_ylabel("$I_{2}/I_{3}$")
ax.text(0, 1.01, "rod")
ax.text(0.75, 1.01, "sphere")
ax.text(0.52, 0.48, "disk")
ax.set_ylim(0.45, 1.05)  # 0.6
ax.set_xlim(-0.05, 1.08) # 1.13
ax.set_aspect(1.88)  # 1.13 / 0.6
ax.set_title('Shape analysis')

ax.plot(
    np.array(mol_shape_cluster)[:, 0, 0],
    np.array(mol_shape_cluster)[:, 0, 1],
    label="Clusters",
    linewidth=0,
    marker="x",
    c='black',
)

# ax.legend(["MD","MD Clusters"], framealpha=0.5)

colorbar = fig.colorbar(scat, label="Energy [kcal/mol]", fraction=0.046, pad=0.04)

fig.tight_layout()
fig.savefig(snakemake.output.NPR_shape_plot, dpi=DPI)
final_figure_axs.append(sg.from_mpl(fig, savefig_kw={"dpi": DPI}))
display(Markdown("Show most extreme structures."))
most_spherical = (x + y).argmax()
most_disk = (x - 0.5 + y - 0.5).argmin()
most_rod = (1 - y + x).argmin()
most_occupied_cluster = cluster_index[0]

fig, axs = plt.subplots(1,4, figsize=(6.7323, 3.2677 / 1.8))
for ax, frame_i, title_i in zip(axs.flatten(), [most_spherical, most_disk, most_rod, most_occupied_cluster], ["most spherical", "most disk-like", "most rod-like", "most pop. cluster"]):
    img = src.utils.pymol_image(t[frame_i], t[most_occupied_cluster])
    ax.imshow(img)
    ax.set_title(title_i)
    ax.axis('off')
fig.tight_layout()
# fig.subplots_adjust(wspace=0, hspace=0)
final_figure_axs.append(sg.from_mpl(fig, savefig_kw={"dpi": DPI}))
Show most extreme structures.

# create a new plot and add a renderer
plot_stride = 10
from bokeh.models import HoverTool

x = np.array(cluster_min_pca)[:, 0, 0]
y = np.array(cluster_min_pca)[:, 0, 1]
percentage = cluster_percentage

data = dict(x=x, y=y, percentage=percentage)


p = figure(
    plot_width=400,
    plot_height=400,
    title="Average cluster structures in PCA space",
    tools="reset",
)
p.dot(
    reduced_dihedrals[::plot_stride, 0],
    reduced_dihedrals[::plot_stride, 1],
    selection_color="firebrick",
    legend_label="simulation frames",
)

hoverable = p.triangle(
    x="x", y="y", source=data, color="firebrick", size=8, legend_label="Clusters"
)
p.add_tools(
    HoverTool(
        tooltips=[("cluster #", "$index"), ("% of total frames", "@percentage{0.0%}")],
        renderers=[hoverable],
    )
)
show(p)
# Interactive viewing of clusters in 3d (needs running jupyter notebook)
cluster_traj = t[cluster_index]
cluster_traj.superpose(
    cluster_traj, 0, atom_indices=cluster_traj.top.select("backbone")
)
view = nv.show_mdtraj(cluster_traj)
view
# save rst files from clusters, account for GaMD equilibration. Does not work with stride.
cluster_full_store = md.load_frame(snakemake.input.traj, cluster_index[0] + frames_start, top=snakemake.input.top)
for idx in cluster_index:
    cluster_full_t = md.load_frame(snakemake.input.traj, idx, top=snakemake.input.top)
    cluster_full_t.save_netcdfrst(
        f"{snakemake.params.rst_dir}rst_{idx}.rst"
    )
    cluster_full_store = cluster_full_store.join(cluster_full_t, discard_overlapping_frames=True)
cluster_full_store.superpose(
    cluster_full_store, 0, atom_indices=cluster_full_t.top.select("backbone")
)
cluster_full_store.save_pdb(snakemake.output.cluster_solvated)
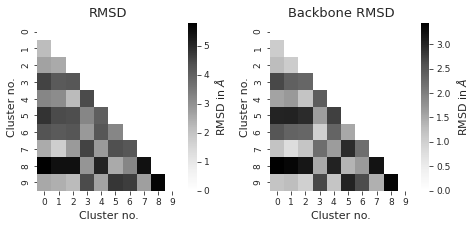
# compute rmsd between clusters
from itertools import combinations

indices = list(combinations(range(cluster_traj.n_frames), 2))

rmsd_backbone = np.zeros((cluster_traj.n_frames, cluster_traj.n_frames))
rmsd = np.zeros((cluster_traj.n_frames, cluster_traj.n_frames))
for i, j in indices:
    rmsd_backbone[i, j] = (
        md.rmsd(
            cluster_traj[i],
            cluster_traj[j],
            atom_indices=cluster_traj.top.select("backbone"),
        )
        * 10
    )
    rmsd[i, j] = md.rmsd(cluster_traj[i], cluster_traj[j]) * 10


sns.set_style("ticks")
fig, axs = plt.subplots(1, 2, figsize=(6.7323, 3.2677))
titles = ["RMSD", "Backbone RMSD"]  # between different clusters
for i, X in enumerate([rmsd, rmsd_backbone]):
    X = X + X.T - np.diag(np.diag(X))
    # get lower diagonal matrix
    X = np.tril(X)
    df = pd.DataFrame(X)
    axs[i] = sns.heatmap(
        df, annot=False, cmap="Greys", ax=axs[i], cbar_kws={"label": r"RMSD in $\AA$"}
    )
    axs[i].set_title(titles[i])
    axs[i].set_xlabel("Cluster no.")
    axs[i].set_ylabel("Cluster no.")
    # ax.invert_xaxis()
fig.tight_layout()
plt.show()
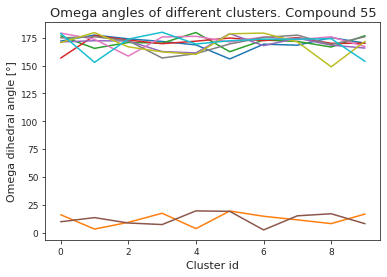
# compute dihedral angles
*_, omega = src.dihedrals.getDihedrals(cluster_traj)
omega_deg = np.abs(np.degrees(omega))
plt.plot(omega_deg)
plt.title(f"Omega angles of different clusters. Compound {compound_index}")
plt.xlabel("Cluster id")
plt.ylabel("Omega dihedral angle [°]")
plt.show()
pymol_script = f"""load {snakemake.output.cluster_pdb}
# inspired by: https://gist.github.com/bobbypaton/1cdc4784f3fc8374467bae5eb410edef
cmd.bg_color("white")
cmd.set("ray_opaque_background", "off")
cmd.set("orthoscopic", 0)
cmd.set("transparency", 0.1)
cmd.set("dash_gap", 0)
cmd.set("ray_trace_mode", 1)
cmd.set("ray_texture", 2)
cmd.set("antialias", 3)
cmd.set("ambient", 0.5)
cmd.set("spec_count", 5)
cmd.set("shininess", 50)
cmd.set("specular", 1)
cmd.set("reflect", .1)
cmd.space("cmyk")

#cmd.cartoon("oval")
cmd.show("sticks")
cmd.show("spheres")
cmd.color("gray85","elem C")
cmd.color("gray98","elem H")
cmd.color("slate","elem N")
cmd.color("red","elem O")
cmd.set("stick_radius",0.07)
cmd.set("sphere_scale",0.18)
cmd.set("sphere_scale",0.13, "elem H")
cmd.set("dash_gap",0.01)
cmd.set("dash_radius",0.07)
cmd.set("stick_color","black")
cmd.set("dash_gap",0.01)
cmd.set("dash_radius",0.035)
cmd.hide("nonbonded")
cmd.hide("cartoon")
cmd.hide("lines")
cmd.orient()
cmd.zoom()
cmd.hide("labels")

cmd.mpng("{snakemake.params.cluster_dir}test_", width=1000, height=1000)

"""
pymol_script_file = f"{snakemake.params.cluster_dir}pym.pml"
with open(pymol_script_file, "w") as f:
    f.write(pymol_script)
# Run pymol to plot clusters
!pymol -c $pymol_script_file
 PyMOL(TM) Molecular Graphics System, Version 2.5.0.
 Copyright (c) Schrodinger, LLC.
 All Rights Reserved.

    Created by Warren L. DeLano, Ph.D.

    PyMOL is user-supported open-source software.  Although some versions
    are freely available, PyMOL is not in the public domain.

    If PyMOL is helpful in your work or study, then please volunteer
    support for our ongoing efforts to create open and affordable scientific
    software by purchasing a PyMOL Maintenance and/or Support subscription.

    More information can be found at "http://www.pymol.org".

    Enter "help" for a list of commands.
    Enter "help <command-name>" for information on a specific command.

 Hit ESC anytime to toggle between text and graphics.

 Detected 24 CPU cores.  Enabled multithreaded rendering.
PyMOL>load data/processed/refactor-test/results/55/H2O/cMD/2000/0/5ead922859f5c96d_clusters/clusters.pdb
 ObjectMolecule: Read crystal symmetry information.
 ObjectMoleculeReadPDBStr: read MODEL 1
 ObjectMoleculeReadPDBStr: read MODEL 2
 ObjectMoleculeReadPDBStr: read MODEL 3
 ObjectMoleculeReadPDBStr: read MODEL 4
 ObjectMoleculeReadPDBStr: read MODEL 5
 ObjectMoleculeReadPDBStr: read MODEL 6
 ObjectMoleculeReadPDBStr: read MODEL 7
 ObjectMoleculeReadPDBStr: read MODEL 8
 ObjectMoleculeReadPDBStr: read MODEL 9
 ObjectMoleculeReadPDBStr: read MODEL 10
 CmdLoad: "" loaded as "clusters".
PyMOL>cmd.bg_color("white")
PyMOL>cmd.set("ray_opaque_background", "off")
PyMOL>cmd.set("orthoscopic", 0)
PyMOL>cmd.set("transparency", 0.1)
PyMOL>cmd.set("dash_gap", 0)
PyMOL>cmd.set("ray_trace_mode", 1)
PyMOL>cmd.set("ray_texture", 2)
PyMOL>cmd.set("antialias", 3)
PyMOL>cmd.set("ambient", 0.5)
PyMOL>cmd.set("spec_count", 5)
PyMOL>cmd.set("shininess", 50)
PyMOL>cmd.set("specular", 1)
PyMOL>cmd.set("reflect", .1)
PyMOL>cmd.space("cmyk")
 Color: loaded table '/biggin/b147/univ4859/research/snakemake_conda/b998fbb8f687250126238eb7f5e2e52c/lib/python3.7/site-packages/pymol/pymol_path/data/pymol/cmyk.png'.
PyMOL>cmd.show("sticks")
PyMOL>cmd.show("spheres")
PyMOL>cmd.color("gray85","elem C")
PyMOL>cmd.color("gray98","elem H")
PyMOL>cmd.color("slate","elem N")
PyMOL>cmd.color("red","elem O")
PyMOL>cmd.set("stick_radius",0.07)
PyMOL>cmd.set("sphere_scale",0.18)
PyMOL>cmd.set("sphere_scale",0.13, "elem H")
PyMOL>cmd.set("dash_gap",0.01)
PyMOL>cmd.set("dash_radius",0.07)
PyMOL>cmd.set("stick_color","black")
PyMOL>cmd.set("dash_gap",0.01)
PyMOL>cmd.set("dash_radius",0.035)
PyMOL>cmd.hide("nonbonded")
PyMOL>cmd.hide("cartoon")
PyMOL>cmd.hide("lines")
PyMOL>cmd.orient()
PyMOL>cmd.zoom()
PyMOL>cmd.hide("labels")
PyMOL>cmd.mpng("data/processed/refactor-test/results/55/H2O/cMD/2000/0/5ead922859f5c96d_clusters/test_", width=1000, height=1000)
 Movie: frame    1 of   10, 0.93 sec. (0:00:09 - 0:00:09 to go).
 Movie: frame    2 of   10, 0.91 sec. (0:00:08 - 0:00:08 to go).
 Movie: frame    3 of   10, 0.93 sec. (0:00:07 - 0:00:07 to go).
 Movie: frame    4 of   10, 0.91 sec. (0:00:06 - 0:00:06 to go).
 Movie: frame    5 of   10, 0.94 sec. (0:00:05 - 0:00:05 to go).
 Movie: frame    6 of   10, 0.91 sec. (0:00:04 - 0:00:04 to go).
 Movie: frame    7 of   10, 0.91 sec. (0:00:03 - 0:00:03 to go).
 Movie: frame    8 of   10, 0.92 sec. (0:00:02 - 0:00:02 to go).
 Movie: frame    9 of   10, 0.90 sec. (0:00:01 - 0:00:01 to go).
 Movie: frame   10 of   10, 0.95 sec. (0:00:00 - 0:00:00 to go).
data = []
cluster_imgs = [
    f"{snakemake.params.cluster_dir}test_{str(i+1).zfill(4)}.png"
    for i in range(cluster_traj.n_frames)
]

[data.append(mpimg.imread(img)) for img in cluster_imgs]
display("Pymol images read")
'Pymol images read'
# get default colors
colors = plt.rcParams["axes.prop_cycle"].by_key()["color"]
# make colors longer if more clusters than colors...
while len(cluster_label_filter) > len(colors):
    colors.extend(colors)
    print("Colors appended..")

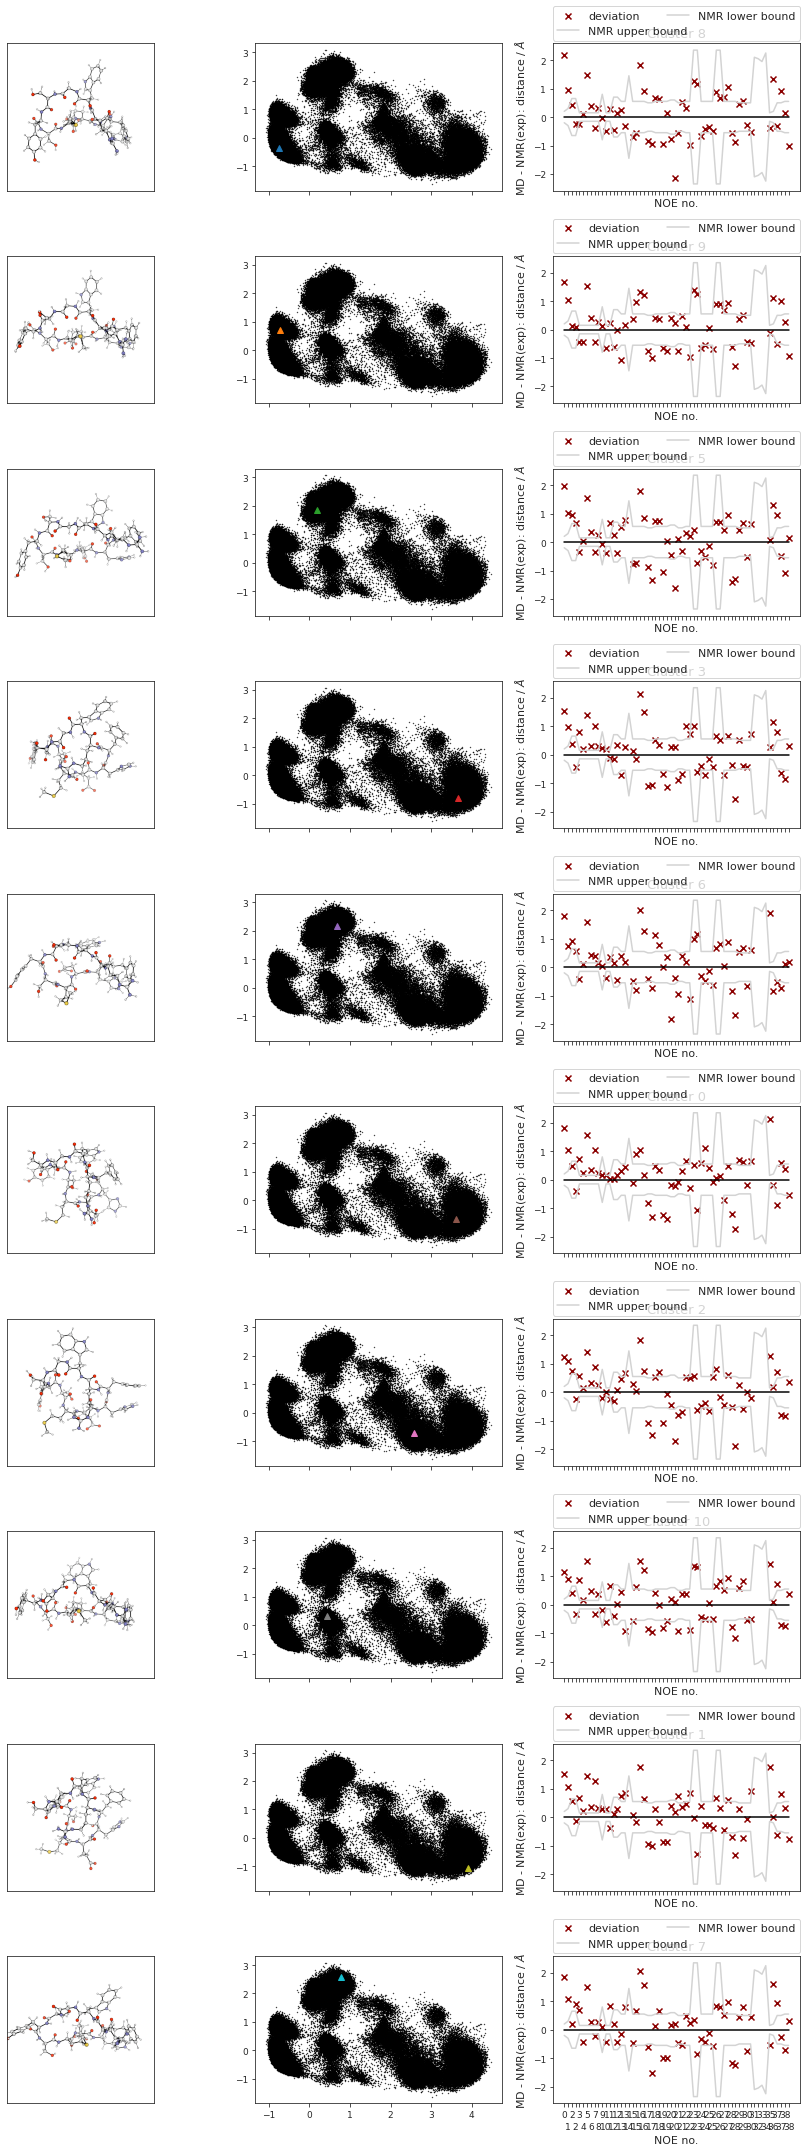
fig, axs = plt.subplots(len(cluster_label_filter), 3, sharex="col", squeeze=False)
fig.set_size_inches(12, 3 * len(cluster_label_filter))
# plot cluster images
for i in range(cluster_traj.n_frames):
    # print(f"final {i}")
    axs[i, 0].imshow(data[i])
    axs[i, 0].tick_params(
        axis="both",
        which="both",
        bottom=False,
        top=False,
        left=False,
        labelleft=False,
        labelbottom=False,
    )
    # axs[i,0].tick_params(axis='y', which='both', bottom=False, top=False, labelbottom=False)
# plot corresponding pca's:
for i in range(cluster_traj.n_frames):
    axs[i, 1].scatter(
        reduced_dihedrals[:, 0],
        reduced_dihedrals[:, 1],
        marker=".",
        s=0.5,
        alpha=1,
        c="black",
    )
# add cluster representations
for ii, iii, iiii in zip(
    cluster_min_pca, cluster_label_filter, range(len(cluster_label_filter))
):
    (clus,) = axs[iiii, 1].plot(
        ii[:, 0],
        ii[:, 1],
        marker="^",
        label=f"Cluster {iii}",
        linewidth=0,
        c=colors[iiii],
    )
    # clus.get_color()


# add noe plots
for i, j, k in zip(range(cluster_traj.n_frames), cluster_index, cluster_label_filter):
    NOE = src.noe.read_NOE(snakemake.input.noe)
    if multiple:
        NOE_trans, NOE_cis = NOE
        NOE_cis_dict = NOE_cis.to_dict(orient="index")
        NOE_trans_dict = NOE_trans.to_dict(orient="index")
    else:
        NOE_dict = NOE.to_dict(orient="index")

    current_cluster = cluster_traj[i]
    # print(j)
    if multiple:
        if j in cis:
            # print("cis")
            NOE_dict = NOE_cis_dict
            NOE = NOE_cis
            axs[i, 2].set_title(f"Cluster {k} (cis)")
        else:
            # print("trans!")
            NOE_dict = NOE_trans_dict
            NOE = NOE_trans
            axs[i, 2].set_title(f"Cluster {k} (trans)")
    else:
        axs[i, 2].set_title(f"Cluster {k}")
    NOE["md"], _, _2, NOE_dist, _3 = src.noe.compute_NOE_mdtraj(
        NOE_dict, current_cluster
    )
    # Deal with ambigous NOEs
    NOE = NOE.explode("md")
    # and ambigous/multiple values
    NOE = NOE.explode("NMR exp")
    fig, axs[i, 2] = src.noe.plot_NOE(NOE, fig, axs[i, 2])
fig.tight_layout()
fig.savefig(snakemake.output.cluster_structs)
NOE 14 error: at least 1 of the atoms is undefined! Set value to NaN
NOE 31 error: at least 1 of the atoms is undefined! Set value to NaN
NOE 32 error: at least 1 of the atoms is undefined! Set value to NaN
NOE 33 error: at least 1 of the atoms is undefined! Set value to NaN
NOE 34 error: at least 1 of the atoms is undefined! Set value to NaN
# TODO? cluster NOE statistics....
2.18.6. NOEs#
In the following section, we compute the NOE values for the simulation.
NOE = src.noe.read_NOE(snakemake.input.noe)
NOE_output = {}
2.18.6.1. NOE without reweighting.#
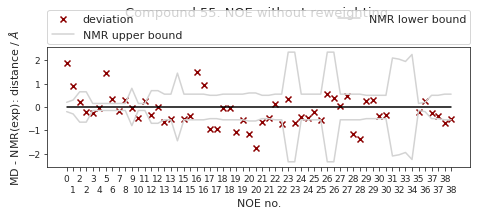
The following NOE plot is computed via \(r^{-6}\) averaging. No reweighting is performed. (so unless the simulation is a conventional MD simulation, the following plot is not a valid comparison to experiment.)
if multiple:
    fig, axs = plt.subplots(2, 1, figsize=(6.7323, 3.2677))
    NOE_trans, NOE_cis = NOE
    NOE_cis_dict = NOE_cis.to_dict(orient="index")
    NOE_trans_dict = NOE_trans.to_dict(orient="index")
    if len(cis) > CIS_TRANS_CUTOFF:
        NOE_cis["md"], _, _2, NOE_dist_cis, _3 = src.noe.compute_NOE_mdtraj(
            NOE_cis_dict, t[cis]
        )

        NOE_output[f"{multi['cis']}"] = NOE_cis.to_dict(orient="index")
        # Deal with ambigous NOEs
        NOE_cis = NOE_cis.explode("md")
        # and ambigous/multiple values
        NOE_cis = NOE_cis.explode("NMR exp")
        fig, axs[1] = src.noe.plot_NOE(NOE_cis, fig, axs[1])
        axs[1].set_title(f"Compound {multi['cis']} (cis)")
    else:
        print("Cis skipped because no frames are cis.")
    if len(trans) > CIS_TRANS_CUTOFF:
        NOE_trans["md"], _, _2, NOE_dist_trans, _3 = src.noe.compute_NOE_mdtraj(
            NOE_trans_dict, t[trans]
        )

        NOE_output[f"{multi['trans']}"] = NOE_trans.to_dict(orient="index")
        # Deal with ambigous NOEs
        NOE_trans = NOE_trans.explode("md")
        # and ambigous/multiple values
        NOE_trans = NOE_trans.explode("NMR exp")

        fig, axs[0] = src.noe.plot_NOE(NOE_trans, fig, axs[0])
        axs[0].set_title(f"Compound {multi['trans']} (trans)")
    else:
        print("Trans skipped because no frames are cis")
else:
    NOE_dict = NOE.to_dict(orient="index")
    NOE["md"], _, _2, NOE_dist, _3 = src.noe.compute_NOE_mdtraj(NOE_dict, t)

    # Save NOE dict
    NOE_output = {f"{compound_index}": NOE.to_dict(orient="index")}
    # Deal with ambigous NOEs
    NOE = NOE.explode("md")
    # and ambigous/multiple values
    NOE = NOE.explode("NMR exp")
    fig, ax = src.noe.plot_NOE(NOE)
    ax.set_title(f"Compound {compound_index}. NOE without reweighting.", y=1.2)
fig.tight_layout()
fig.savefig(snakemake.output.noe_plot, dpi=DPI)
# save as .json file
src.utils.json_dump(snakemake.output.noe_result, NOE_output)
NOE 14 error: at least 1 of the             atoms is undefined! Set value to NaN
NOE 31 error: at least 1 of the             atoms is undefined! Set value to NaN
NOE 32 error: at least 1 of the             atoms is undefined! Set value to NaN
NOE 33 error: at least 1 of the             atoms is undefined! Set value to NaN
NOE 34 error: at least 1 of the             atoms is undefined! Set value to NaN
2.18.6.2. Reweighted NOEs#
The following NOE plot was reweighted via a 1d PMF method.
# 1d PMF reweighted NOEs

NOE_output = {}

if snakemake.params.method != "cMD":
    if multiple:
        fig, axs = plt.subplots(2, 1, figsize=(6.7323, 6.7323))
        NOE_trans, NOE_cis = NOE
        NOE_cis_dict = NOE_cis.to_dict(orient="index")
        NOE_trans_dict = NOE_trans.to_dict(orient="index")
        if len(cis) > CIS_TRANS_CUTOFF:
            (
                NOE_cis["md"],
                NOE_cis["lower"],
                NOE_cis["upper"],
                NOE_dist_cis,
                pmf_plot_cis,
            ) = src.noe.compute_NOE_mdtraj(
                NOE_cis_dict, t[cis],
                reweigh_type=1, slicer=cis, weight_data=weight_data,
            )
            # TODO: this should not give an error!

            NOE_output[f"{multi['cis']}"] = NOE_cis.to_dict(orient="index")

            # Deal with ambigous NOEs
            NOE_cis = NOE_cis.explode(["md", "lower", "upper"])
            # and ambigous/multiple values
            NOE_cis = NOE_cis.explode("NMR exp")
            fig, axs[1] = src.noe.plot_NOE(NOE_cis, fig, axs[1])
            axs[1].set_title(f"Compound {multi['cis']} (cis)")
        else:
            print("Cis skipped because no frames are cis.")
        if len(trans) > CIS_TRANS_CUTOFF:
            (
                NOE_trans["md"],
                NOE_trans["lower"],
                NOE_trans["upper"],
                NOE_dist_trans,
                pmf_plot_trans,
            ) = src.noe.compute_NOE_mdtraj(
                NOE_trans_dict, t[trans],
                reweigh_type=1, slicer=trans, weight_data=weight_data
            )

            NOE_output[f"{multi['trans']}"] = NOE_trans.to_dict(orient="index")
            # Deal with ambigous NOEs
            NOE_trans = NOE_trans.explode(["md", "lower", "upper"])
            # and ambigous/multiple values
            NOE_trans = NOE_trans.explode("NMR exp")
            fig, axs[0] = src.noe.plot_NOE(NOE_trans, fig, axs[0])
            axs[0].set_title(f"Compound {multi['trans']} (trans)")
        else:
            print("Trans skipped because no frames are cis")
        src.utils.json_dump(snakemake.output.noe_result, NOE_output)
        fig.tight_layout()
        fig.savefig(snakemake.output.noe_plot)
    else:
        NOE = src.noe.read_NOE(snakemake.input.noe)
        NOE_dict = NOE.to_dict(orient="index")
        NOE["md"], NOE["lower"], NOE["upper"], _, pmf_plot = src.noe.compute_NOE_mdtraj(
            NOE_dict, t, reweigh_type=1, weight_data=weight_data
        )
        plt.close()
        # Save NOE dict
        NOE_output = {f"{compound_index}": NOE.to_dict(orient="index")}
        # save as .json file
        src.utils.json_dump(snakemake.output.noe_result, NOE_output)

        # Deal with ambigous NOEs
        NOE = NOE.explode(["md", "lower", "upper"])
        # and ambigous/multiple values
        NOE = NOE.explode("NMR exp")
        fig, ax = src.noe.plot_NOE(NOE)
#         ax.set_title(f"Compound {compound_index}. NOE", y=1.5, pad=0)
        fig.tight_layout()
        fig.savefig(snakemake.output.noe_plot, dpi=DPI)
else:
    print("cMD - no reweighted NOEs performed.")
final_figure_axs.append(sg.from_mpl(fig))
pickle_dump(snakemake.output.noe_dist, NOE_dist)
cMD - no reweighted NOEs performed.
display(NOE)
| Atom 1 | Atom 2 | NMR exp | lower bound | upper bound | md | |
|---|---|---|---|---|---|---|
| 0 | (12,) | (33,) | 3.00 | 2.8 | 3.2 | 4.895356 |
| 1 | (33,) | (44,) | 3.60 | 3.3 | 3.9 | 4.505091 |
| 2 | (1,) | (163, 164) | 2.55 | 1.9 | 3.2 | 2.746672 |
| 2 | (1,) | (163, 164) | 2.55 | 1.9 | 3.2 | 2.33064 |
| 3 | (12,) | (3,) | 2.65 | 2.5 | 2.8 | 2.393977 |
| 4 | (12,) | (14,) | 2.75 | 2.6 | 2.9 | 2.705324 |
| 5 | (33,) | (14,) | 2.15 | 2.0 | 2.3 | 3.615444 |
| 6 | (33,) | (35,) | 2.55 | 2.4 | 2.7 | 2.898933 |
| 7 | (61,) | (46,) | 2.45 | 2.3 | 2.6 | 2.266685 |
| 8 | (61,) | (63,) | 2.65 | 2.5 | 2.8 | 2.936919 |
| 9 | (113,) | (95,) | 2.20 | 1.4 | 3.0 | 2.136305 |
| 10 | (113,) | (115,) | 2.75 | 2.6 | 2.9 | 2.294271 |
| 11 | (137,) | (115,) | 2.35 | 2.2 | 2.5 | 2.620258 |
| 12 | (161,) | (163, 164) | 2.70 | 2.0 | 3.4 | 2.35413 |
| 12 | (161,) | (163, 164) | 2.70 | 2.0 | 3.4 | 2.713425 |
| 13 | (12,) | (5, 6) | 3.65 | 3.1 | 4.2 | 3.0232 |
| 13 | (12,) | (5, 6) | 3.65 | 3.1 | 4.2 | 3.119115 |
| 14 | (12,) | () | 3.85 | 2.4 | 5.3 | NaN |
| 15 | (12,) | (16, 17) | 3.05 | 2.5 | 3.6 | 2.54556 |
| 15 | (12,) | (16, 17) | 3.05 | 2.5 | 3.6 | 2.652637 |
| 16 | (33,) | (16, 17) | 3.35 | 2.8 | 3.9 | 4.839479 |
| 16 | (33,) | (16, 17) | 3.35 | 2.8 | 3.9 | 4.294346 |
| 17 | (33,) | (37, 38) | 3.50 | 3.0 | 4.0 | 2.577387 |
| 17 | (33,) | (37, 38) | 3.50 | 3.0 | 4.0 | 2.574884 |
| 18 | (44,) | (37, 38) | 3.45 | 2.9 | 4.0 | 3.396157 |
| 18 | (44,) | (37, 38) | 3.45 | 2.9 | 4.0 | 3.404194 |
| 19 | (44,) | (48, 49) | 3.55 | 3.0 | 4.1 | 2.45645 |
| 19 | (44,) | (48, 49) | 3.55 | 3.0 | 4.1 | 2.975417 |
| 20 | (44,) | (51, 52) | 4.30 | 3.7 | 4.9 | 3.123772 |
| 20 | (44,) | (51, 52) | 4.30 | 3.7 | 4.9 | 2.544023 |
| 21 | (61,) | (65, 66) | 3.20 | 2.7 | 3.7 | 2.566057 |
| 21 | (61,) | (65, 66) | 3.20 | 2.7 | 3.7 | 2.708351 |
| 22 | (76,) | (65, 66) | 3.55 | 3.0 | 4.1 | 3.683285 |
| 22 | (76,) | (65, 66) | 3.55 | 3.0 | 4.1 | 2.801143 |
| 23 | (76,) | (68, 69) | 3.65 | 1.3 | 6.0 | 4.011928 |
| 23 | (76,) | (68, 69) | 3.65 | 1.3 | 6.0 | 2.953362 |
| 24 | (76,) | (80, 81) | 2.95 | 2.4 | 3.5 | 2.511455 |
| 24 | (76,) | (80, 81) | 2.95 | 2.4 | 3.5 | 2.485299 |
| 25 | (93,) | (97, 98) | 2.95 | 2.4 | 3.5 | 2.745744 |
| 25 | (93,) | (97, 98) | 2.95 | 2.4 | 3.5 | 2.406656 |
| 26 | (113,) | (97, 98) | 3.65 | 1.3 | 6.0 | 4.213041 |
| 26 | (113,) | (97, 98) | 3.65 | 1.3 | 6.0 | 4.014333 |
| 27 | (113,) | (117, 118) | 3.05 | 2.5 | 3.6 | 3.082242 |
| 27 | (113,) | (117, 118) | 3.05 | 2.5 | 3.6 | 3.501947 |
| 28 | (113,) | (120, 121) | 4.15 | 3.6 | 4.7 | 3.007266 |
| 28 | (113,) | (120, 121) | 4.15 | 3.6 | 4.7 | 2.778221 |
| 29 | (137,) | (117, 118) | 3.80 | 3.3 | 4.3 | 4.062879 |
| 29 | (137,) | (117, 118) | 3.80 | 3.3 | 4.3 | 4.100506 |
| 30 | (137,) | (141, 142) | 3.00 | 2.5 | 3.5 | 2.613423 |
| 30 | (137,) | (141, 142) | 3.00 | 2.5 | 3.5 | 2.640715 |
| 31 | () | (14,) | 2.90 | 0.8 | 5.0 | NaN |
| 32 | () | (16, 17) | 3.25 | 1.2 | 5.3 | NaN |
| 33 | () | (97, 98) | 3.45 | 1.5 | 5.4 | NaN |
| 34 | () | (95,) | 3.05 | 0.8 | 5.3 | NaN |
| 35 | (156,) | (139,) | 3.05 | 2.9 | 3.2 | 2.825114 |
| 36 | (145,) | (139,) | 3.20 | 3.0 | 3.4 | 3.449006 |
| 37 | (156,) | (141, 142) | 3.40 | 2.9 | 3.9 | 3.140659 |
| 37 | (156,) | (141, 142) | 3.40 | 2.9 | 3.9 | 3.005652 |
| 38 | (145,) | (141, 142) | 3.45 | 2.9 | 4.0 | 2.747215 |
| 38 | (145,) | (141, 142) | 3.45 | 2.9 | 4.0 | 2.942025 |
# matplotlib.rcParams.update(matplotlib.rcParamsDefault)

if snakemake.params.method != "cMD":
    if not multiple:
        pmf_plot.suptitle("NOE PMF plots")
        pmf_plot.tight_layout()
        pmf_plot.savefig(snakemake.output.noe_pmf)
        fig = pmf_plot
    else:
        # save to image data
        io_cis = io.BytesIO()
        io_trans = io.BytesIO()
        if len(cis) > CIS_TRANS_CUTOFF:
            pmf_plot_cis.savefig(io_cis, format="raw", dpi=pmf_plot_cis.dpi)
        if len(trans) > CIS_TRANS_CUTOFF:
            pmf_plot_trans.savefig(io_trans, format="raw", dpi=pmf_plot_trans.dpi)

        if len(cis) > CIS_TRANS_CUTOFF:
            io_cis.seek(0)
            img_cis = np.reshape(
                np.frombuffer(io_cis.getvalue(), dtype=np.uint8),
                newshape=(
                    int(pmf_plot_cis.bbox.bounds[3]),
                    int(pmf_plot_cis.bbox.bounds[2]),
                    -1,
                ),
            )
            io_cis.close()

        if len(trans) > CIS_TRANS_CUTOFF:
            io_trans.seek(0)
            img_trans = np.reshape(
                np.frombuffer(io_trans.getvalue(), dtype=np.uint8),
                newshape=(
                    int(pmf_plot_trans.bbox.bounds[3]),
                    int(pmf_plot_trans.bbox.bounds[2]),
                    -1,
                ),
            )
            io_trans.close()

        fig, axs = plt.subplots(2, 1)
        fig.set_size_inches(16, 30)
        if len(cis) > CIS_TRANS_CUTOFF:
            axs[0].imshow(img_cis)
            axs[0].axis("off")
            axs[0].set_title("cis")
        if len(trans) > CIS_TRANS_CUTOFF:
            axs[1].imshow(img_trans)
            axs[1].set_title("trans")
            axs[1].axis("off")
        # fig.suptitle('PMF plots. PMF vs. distance')
        fig.tight_layout()
        fig.savefig(snakemake.output.noe_pmf, dpi=DPI)
else:
    fig, ax = plt.subplots()
    ax.text(0.5, 0.5, "not applicable.")
    fig.savefig(snakemake.output.noe_pmf, dpi=DPI)
display(fig)
2.18.7. NOE-Statistics#
Following, we compute various statistical metrics to evaluate how the simulated NOEs compare to the experimental ones.
# Compute deviations of experimental NOE values to the MD computed ones
NOE_stats_keys = []
NOE_i = []
NOE_dev = {}

if multiple:
    if len(cis) > CIS_TRANS_CUTOFF:
        NOE_stats_keys.append("cis")
        NOE_i.append(NOE_cis)
    if len(trans) > CIS_TRANS_CUTOFF:
        NOE_stats_keys.append("trans")
        NOE_i.append(NOE_trans)
else:
    NOE_stats_keys.append("single")
    NOE_i.append(NOE)

for k, NOE_d in zip(NOE_stats_keys, NOE_i):
    if (NOE_d["NMR exp"].to_numpy() == 0).all():
        # if all exp values are 0: take middle between upper / lower bound as reference value
        NOE_d["NMR exp"] = (NOE_d["upper bound"] + NOE_d["lower bound"]) * 0.5

    # Remove duplicate values (keep value closest to experimental value)
    NOE_d["dev"] = NOE_d["md"] - np.abs(NOE_d["NMR exp"])
    NOE_d["abs_dev"] = np.abs(NOE_d["md"] - np.abs(NOE_d["NMR exp"]))

    NOE_d = NOE_d.sort_values("abs_dev", ascending=True)
    NOE_d.index = NOE_d.index.astype(int)
    NOE_d = NOE_d[~NOE_d.index.duplicated(keep="first")].sort_index(kind="mergesort")

    NOE_d = NOE_d.dropna()
    NOE_dev[k] = NOE_d
# Compute NOE statistics
NOE_stats = {}

for k in NOE_stats_keys:
    NOE_d = NOE_dev[k]
    NOE_stats_k = pd.DataFrame(columns=["stat", "value", "up", "low"])

    MAE, upper, lower = src.stats.compute_MAE(NOE_d["NMR exp"], NOE_d["md"])
    append = {"stat": "MAE", "value": MAE, "up": upper, "low": lower}
    NOE_stats_k = NOE_stats_k.append(append, ignore_index=True)

    MSE, upper, lower = src.stats.compute_MSE(NOE_d["dev"])
    append = {"stat": "MSE", "value": MSE, "up": upper, "low": lower}
    NOE_stats_k = NOE_stats_k.append(append, ignore_index=True)

    RMSD, upper, lower = src.stats.compute_RMSD(NOE_d["NMR exp"], NOE_d["md"])
    append = {"stat": "RMSD", "value": RMSD, "up": upper, "low": lower}
    NOE_stats_k = NOE_stats_k.append(append, ignore_index=True)

    pearsonr, upper, lower = src.stats.compute_pearsonr(NOE_d["NMR exp"], NOE_d["md"])
    append = {"stat": "pearsonr", "value": pearsonr, "up": upper, "low": lower}
    NOE_stats_k = NOE_stats_k.append(append, ignore_index=True)

    kendalltau, upper, lower = src.stats.compute_kendalltau(
        NOE_d["NMR exp"], NOE_d["md"]
    )
    append = {"stat": "kendalltau", "value": kendalltau, "up": upper, "low": lower}
    NOE_stats_k = NOE_stats_k.append(append, ignore_index=True)

    chisq, upper, lower = src.stats.compute_chisquared(NOE_d["NMR exp"], NOE_d["md"])
    append = {"stat": "chisq", "value": chisq, "up": upper, "low": lower}
    NOE_stats_k = NOE_stats_k.append(append, ignore_index=True)

    fulfilled = src.stats.compute_fulfilled_percentage(NOE_d)
    append = {"stat": "percentage_fulfilled", "value": fulfilled, "up": 0, "low": 0}
    NOE_stats_k = NOE_stats_k.append(append, ignore_index=True)

    NOE_stats[k] = NOE_stats_k
# Compute statistics for most populated cluster
if multiple:
    NOE_stats_keys = ["cis", "trans"]
    differentiation = {"cis": cis, "trans": trans}
else:
    NOE_stats_keys = ["single"]

n_cluster_traj = {}
n_cluster_percentage = {}
n_cluster_index = {}
remover = []
for k in NOE_stats_keys:
    if multiple:
        cluster_in_x = np.in1d(cluster_index, differentiation[k])
        print(cluster_in_x)
        if np.all(cluster_in_x == False):
            # No clusters found for specific cis/trans/other
            remover.append(k)
    else:
        cluster_in_x = np.ones((len(cluster_index)), dtype=bool)
    cluster_in_x = np.arange(0, len(cluster_index))[cluster_in_x]
    n_cluster_traj[k] = cluster_traj[cluster_in_x]
    n_cluster_percentage[k] = np.array(cluster_percentage)[cluster_in_x]
    n_cluster_index[k] = np.array(cluster_index)[cluster_in_x]
cluster_traj = n_cluster_traj
cluster_percentage = n_cluster_percentage
cluster_index = n_cluster_index
[NOE_stats_keys.remove(k) for k in remover]
[]
# Compute statistics for most populated cluster
NOE_dict = {}
NOE = src.noe.read_NOE(snakemake.input.noe)
NOE_n = {}
if multiple:
    NOE_trans, NOE_cis = NOE
    NOE_n["cis"] = NOE_cis
    NOE_n["trans"] = NOE_trans
    NOE_dict["cis"] = NOE_cis.to_dict(orient="index")
    NOE_dict["trans"] = NOE_trans.to_dict(orient="index")
else:
    NOE_dict["single"] = NOE.to_dict(orient="index")
    NOE_n["single"] = NOE


for k in NOE_stats_keys:
    # max. populated cluster
    # NOE = NOE_n.copy()
    max_populated_cluster_idx = np.argmax(cluster_percentage[k])
    max_populated_cluster = cluster_traj[k][max_populated_cluster_idx]
    NOE_n[k]["md"], *_ = src.noe.compute_NOE_mdtraj(NOE_dict[k], max_populated_cluster)
    # Deal with ambigous NOEs
    NOE_n[k] = NOE_n[k].explode("md")
    # and ambigous/multiple values
    NOE_n[k] = NOE_n[k].explode("NMR exp")

    # Remove duplicate values (keep value closest to experimental value)
    NOE_test = NOE_n[k]
    if (NOE_test["NMR exp"].to_numpy() == 0).all():
        # if all exp values are 0: take middle between upper / lower bound as reference value
        NOE_test["NMR exp"] = (NOE_test["upper bound"] + NOE_test["lower bound"]) * 0.5
    NOE_test["dev"] = NOE_test["md"] - np.abs(NOE_test["NMR exp"])
    NOE_test["abs_dev"] = np.abs(NOE_test["md"] - np.abs(NOE_test["NMR exp"]))

    NOE_test = NOE_test.sort_values("abs_dev", ascending=True)
    NOE_test.index = NOE_test.index.astype(int)
    NOE_test = NOE_test[~NOE_test.index.duplicated(keep="first")].sort_index(
        kind="mergesort"
    )

    # drop NaN values:
    NOE_test = NOE_test.dropna()
    # Compute metrics now
    # Compute NOE statistics, since no bootstrap necessary, do a single iteration.. TODO: could clean this up further to pass 0, then just return the value...
    RMSD, *_ = src.stats.compute_RMSD(
        NOE_test["NMR exp"], NOE_test["md"], n_bootstrap=1
    )
    MAE, *_ = src.stats.compute_MAE(NOE_test["NMR exp"], NOE_test["md"], n_bootstrap=1)
    MSE, *_ = src.stats.compute_MSE(NOE_test["dev"], n_bootstrap=1)
    fulfil = src.stats.compute_fulfilled_percentage(NOE_test)
    # insert values
    values = [MAE, MSE, RMSD, None, None, None, fulfil]
    NOE_stats[k].insert(4, "most-populated-1", values)

# If there are no cis/trans clusters, still write a column 'most-populated-1', but fill with NaN
for k in remover:
    values = [np.nan, np.nan, np.nan, np.nan, np.nan, np.nan, np.nan]
    NOE_stats[k].insert(4, "most-populated-1", values)
NOE 14 error: at least 1 of the             atoms is undefined! Set value to NaN
NOE 31 error: at least 1 of the             atoms is undefined! Set value to NaN
NOE 32 error: at least 1 of the             atoms is undefined! Set value to NaN
NOE 33 error: at least 1 of the             atoms is undefined! Set value to NaN
NOE 34 error: at least 1 of the             atoms is undefined! Set value to NaN
for k in NOE_stats.keys():
    display(NOE_stats[k])
    # convert df to dict for export
    NOE_stats[k] = NOE_stats[k].to_dict()
# Save
src.utils.json_dump(snakemake.output.noe_stats, NOE_stats)
| stat | value | up | low | most-populated-1 | |
|---|---|---|---|---|---|
| 0 | MAE | 0.470874 | 0.622284 | 0.336884 | 0.559559 |
| 1 | MSE | -0.016161 | 0.203517 | 0.000000 | 0.212435 |
| 2 | RMSD | 0.636781 | 0.822416 | 0.437024 | 0.714309 |
| 3 | pearsonr | 0.445324 | 0.717785 | 0.190475 | NaN |
| 4 | kendalltau | 0.423448 | 0.622262 | 0.207691 | NaN |
| 5 | chisq | 4.458163 | 7.783250 | 1.945874 | NaN |
| 6 | percentage_fulfilled | 0.529412 | 0.000000 | 0.000000 | 0.470588 |
plt.rc('font', size=MEDIUM_SIZE)          # controls default text sizes
plt.rc('axes', titlesize=BIGGER_SIZE)     # fontsize of the axes title
plt.rc('axes', labelsize=MEDIUM_SIZE)    # fontsize of the x and y labels
plt.rc('xtick', labelsize=MEDIUM_SIZE)    # fontsize of the tick labels
plt.rc('ytick', labelsize=MEDIUM_SIZE)    # fontsize of the tick labels
plt.rc('legend', fontsize=MEDIUM_SIZE)    # legend fontsize
plt.rc('figure', titlesize=BIGGER_SIZE)  # fontsize of the figure title


if multiple:
    fig, axs = plt.subplots(2, 1)
    if len(cis) > CIS_TRANS_CUTOFF:
        # cis
        axs[0].scatter(NOE_dev["cis"]["NMR exp"], NOE_dev["cis"]["md"])
        axs[0].set_ylabel("MD")
        axs[0].set_xlabel("Experimental NOE value")
        axs[0].axline((1.5, 1.5), slope=1, color="black")
        axs[0].set_title("Experimental vs MD derived NOE values - cis")

    if len(trans) > CIS_TRANS_CUTOFF:
        # trans
        axs[1].scatter(NOE_dev["trans"]["NMR exp"], NOE_dev["trans"]["md"])
        axs[1].set_ylabel("MD")
        axs[1].set_xlabel("Experimental NOE value")
        axs[1].axline((1.5, 1.5), slope=1, color="black")
        axs[1].set_title("Experimental vs MD derived NOE values - trans")
    fig.tight_layout()
    fig.savefig(snakemake.output.noe_stat_plot)
else:
    plt.scatter(NOE_dev["single"]["NMR exp"], NOE_dev["single"]["md"])
    if snakemake.params.method != "cMD":
        plt.scatter(
            NOE_dev["single"]["NMR exp"], NOE_dev["single"]["upper"], marker="_"
        )
        plt.scatter(
            NOE_dev["single"]["NMR exp"], NOE_dev["single"]["lower"], marker="_"
        )
    plt.ylabel("MD")
    plt.xlabel("Experimental NOE value")
    plt.axline((1.5, 1.5), slope=1, color="black")
    plt.title("Experimental vs MD derived NOE values")
    plt.tight_layout()
    plt.savefig(snakemake.output.noe_stat_plot)
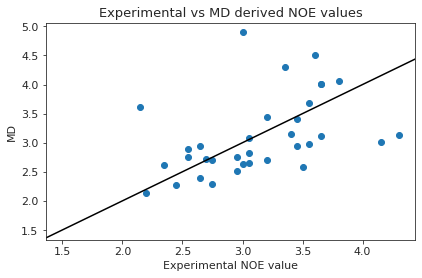
# is the mean deviation significantly different than 0? if pvalue < 5% -> yes! We want: no! (does not deviate from exp. values)
if multiple:
    if len(cis) > CIS_TRANS_CUTOFF:
        print(stats.ttest_1samp(NOE_dev["cis"]["dev"], 0.0))
    if len(trans) > CIS_TRANS_CUTOFF:
        print(stats.ttest_1samp(NOE_dev["trans"]["dev"], 0.0))
else:
    print(stats.ttest_1samp(NOE_dev["single"]["dev"], 0.0))
Ttest_1sampResult(statistic=-0.1458367228241723, pvalue=0.8849374836973514)
if multiple:
    if len(cis) > CIS_TRANS_CUTOFF:
        print(stats.describe(NOE_dev["cis"]["dev"]))
    if len(trans) > CIS_TRANS_CUTOFF:
        print(stats.describe(NOE_dev["trans"]["dev"]))
else:
    print(stats.describe(NOE_dev["single"]["dev"]))
DescribeResult(nobs=34, minmax=(-1.176227584751635, 1.8953562788083378), mean=-0.016160695857287587, variance=0.41750841956768914, skewness=0.8653791281747992, kurtosis=1.355585641810154)
# Make overview figure
plot1 = final_figure_axs[0].getroot()
plot2 = final_figure_axs[1].getroot()
plot3 = final_figure_axs[2].getroot()
plot4 = final_figure_axs[3].getroot()
plot5 = final_figure_axs[4].getroot()
if multiple:
#     # TODO: fix this!
#         sc.Figure(
#         "4039",
#         "5048",
#         sc.Panel(plot3, sc.Text("A", 0, 0, size=16, weight='bold')),
#         sc.Panel(
#             plot2,
#             sc.Text("B", "8.5cm", "0cm", size=16),
#         ).move(0,200),
#         sc.Panel(plot4, sc.Text("C", 25, 20, size=16, weight='bold')),
#         # sc.Panel(plot4, sc.Text("D", 25, 20, size=20, weight='bold')).scale(0.8).move(-200,0),
#     ).tile(2, 2).save(snakemake.output.overview_plot)
    sc.Figure(
        "4039",
        "7068", # 5048
        sc.Panel(plot2, sc.Text("A", 25, 20, size=16, weight='bold').move(-12,0)).scale(8),
        sc.Panel(plot3, sc.Text("B", 25, 20, size=16, weight='bold').move(-12,0)).scale(8),
        sc.Panel(plot4, sc.Text("C", 25, 20, size=16, weight='bold').move(-12,-24)).scale(8).move(0, -300),
        sc.Panel(sc.Text("2")),
        sc.Panel(plot5, sc.Text("D", 25, 20, size=16, weight='bold').move(-12,0)).scale(8).move(0, -1550),
        # sc.Panel(plot1, sc.Text("D", 25, 0, size=16, weight='bold')),
    ).tile(2, 3).save(snakemake.output.overview_plot)
else:
    sc.Figure(
        "4039",
        "5048", # 4039
        sc.Panel(plot2, sc.Text("A", 25, 20, size=16, weight='bold').move(-12,0)).scale(8),
        sc.Panel(plot3, sc.Text("B", 25, 20, size=16, weight='bold').move(-12,0)).scale(8),
        sc.Panel(plot4, sc.Text("C", 25, 20, size=16, weight='bold').move(-12,-24)).scale(8).move(0, 350),
        sc.Panel(sc.Text("2")),
        sc.Panel(plot5, sc.Text("D", 25, 20, size=16, weight='bold').move(-12,0)).scale(8).move(0, -250),
        # sc.Panel(plot1, sc.Text("D", 25, 0, size=16, weight='bold')),
    ).tile(2, 3).save(snakemake.output.overview_plot)
src.utils.show_svg(snakemake.output.overview_plot)
print("Done")
Done
