Method Comparison
4.1. Method Comparison#
Comparison of MD and cheminformatics methods.
# from src.utils import json_load
import src.utils
import pandas as pd
import numpy as np
import matplotlib.pyplot as plt
import seaborn as sns
from scipy import stats
from statannotations.Annotator import Annotator
import statsmodels
import itertools

plt.style.use("seaborn-paper")
plt.rcParams["svg.fonttype"] = "none"
sns.set_context("paper")

# set matplotlib font sizes
SMALL_SIZE = 13
MEDIUM_SIZE = 14
BIGGER_SIZE = 16

plt.rc("font", size=MEDIUM_SIZE)  # controls default text sizes
plt.rc("axes", titlesize=MEDIUM_SIZE)  # fontsize of the axes title
plt.rc("axes", labelsize=MEDIUM_SIZE)  # fontsize of the x and y labels
plt.rc("xtick", labelsize=SMALL_SIZE)  # fontsize of the tick labels
plt.rc("ytick", labelsize=SMALL_SIZE)  # fontsize of the tick labels
plt.rc("legend", fontsize=MEDIUM_SIZE)  # legend fontsize
plt.rc("figure", titlesize=BIGGER_SIZE)  # fontsize of the figure title

DPI = 600
/tmp/ipykernel_1490486/1737975291.py:12: MatplotlibDeprecationWarning: The seaborn styles shipped by Matplotlib are deprecated since 3.6, as they no longer correspond to the styles shipped by seaborn. However, they will remain available as 'seaborn-v0_8-<style>'. Alternatively, directly use the seaborn API instead.
  plt.style.use("seaborn-paper")
method_len = int(len(snakemake.wildcards.methods.split("-")) / 2)
confgen_len = int(len(snakemake.wildcards.conf_gens.split("-")) / 2)

results = [
    src.utils.json_load(i) for i in snakemake.input[0 : 2 * method_len : 2]
]
file_names = snakemake.input[0:method_len]
if len(snakemake.input) < (method_len + confgen_len):
    add_confgens = False
else:
    confgen = [src.utils.json_load(i) for i in snakemake.input[method_len:]]
    confgen_names = []
    for i, j in zip(
        snakemake.wildcards.conf_gens.split("-")[0::2],
        snakemake.wildcards.conf_gens.split("-")[1::2],
    ):
        confgen_names.append("-".join([i, j]))
    add_confgens = True
df = pd.DataFrame()
dfs = {
    "RMSD": pd.DataFrame(),
    "MAE": pd.DataFrame(),
    "percentage_fulfilled": pd.DataFrame(),
}
# Load methods
for a in file_names:
    method_dict = src.utils.json_load(a)
    method_dict_n = {}
    for key_o, value_o in method_dict.items():
        df3 = pd.DataFrame.from_dict(method_dict["RMSD"])
        method_dict_n[key_o] = {}
        for key, value in value_o.items():
            tmp_dict = {}
            #             print(key, value)
            for k, v in value.items():
                tmp_k = k.split("-")[1]
                if tmp_k.split("_")[-1] == "single":
                    tmp_k = tmp_k.split("_")[0:-1]
                    tmp_k = "_".join(tmp_k)
                tmp_dict[tmp_k] = v
            method_dict_n[key_o][
                f"{key}-{a.split('/')[5].split('NOE')[0]}"
            ] = tmp_dict
        df2 = pd.DataFrame.from_dict(method_dict_n[key_o])
        dfs[key_o] = pd.concat([dfs[key_o], df2], axis=1)
confgen_keys = {"RMSD": "rmsd", "MAE": "mae", "percentage_fulfilled": "fulfil"}
if add_confgens:
    for c, n in zip(confgen, confgen_names):
        for key, value in dfs.items():
            confgen_key = confgen_keys[key]
            c[confgen_key]["licuv"] = {
                k.split("_single")[0]: v
                for k, v in c[confgen_key]["licuv"].items()
            }
            c[confgen_key]["namfis"] = {
                k.split("_single")[0]: v
                for k, v in c[confgen_key]["namfis"].items()
            }
            c[confgen_key]["low_energy"] = {
                k.split("_single")[0]: v
                for k, v in c[confgen_key]["low_energy"].items()
            }
            c[confgen_key]["random"] = {
                k.split("_single")[0]: v
                for k, v in c[confgen_key]["random"].items()
            }
            df2 = pd.DataFrame.from_dict(
                c[confgen_key]["best"],
                orient="index",
                columns=[f"{n} {'best'}"],
                dtype=float,
            )
            l_columns = [f"{n} licuv {l}" for l in [1, 3, 5, 10, 30]]
            df3 = pd.DataFrame.from_dict(
                c[confgen_key]["licuv"],
                orient="index",
                columns=[f"{n}-licuv-{l}" for l in [1, 3, 5, 10, 30]],
                dtype=float,
            )
            df3 = df3.drop(
                columns=[f"{n}-licuv-{l}" for l in [1, 3, 5, 30]]
            )  # 10,
            df4 = pd.DataFrame.from_dict(
                c[confgen_key]["low_energy"],
                orient="index",
                columns=[f"{n}-low_energy-{l}" for l in [1, 3, 5, 10, 30]],
                dtype=float,
            )
            df4 = df4.drop(
                columns=[f"{n}-low_energy-{l}" for l in [1, 3, 5, 30]]
            )  # 10,
            df5 = pd.DataFrame.from_dict(
                c[confgen_key]["random"],
                orient="index",
                columns=[f"{n}-random-{l}" for l in [1, 3, 5, 10, 30]],
                dtype=float,
            )
            df5 = df5.drop(
                columns=[f"{n}-random-{l}" for l in [3, 5, 30]]
            )  # 10,
            df6 = pd.DataFrame.from_dict(
                c[confgen_key]["namfis"],
                orient="index",
                columns=[f"{n}-namfis-{l}" for l in [1, 3, 5, 10, 30]],
                dtype=float,
            )
            df6 = df6.drop(
                columns=[f"{n}-namfis-{l}" for l in [1, 3, 5, 30]]
            )  # 10,
            dfs[key] = pd.concat([dfs[key], df2, df3, df4, df5, df6], axis=1)
dfs["percentage_fulfilled"].rename(
    columns=lambda x: x.replace("value-", "ensemble ")
    .replace("most-populated-1-", "cluster ")
    .replace("-H2O-2000-nan-", "")
    .replace("-native-2000-nan-", "")
    .replace("-native-2000-3-", "")
    .replace("omega-basic", "Omega")
    .replace("rdkit-ETKDGv3mmff", "RDKit ")
    .replace("-", " ")
    .replace("  ", " ")
    .replace("namfis", "NAMFIS")
    .replace("licuv", "LICUV"),
    inplace=True,
)

dfs["RMSD"].rename(
    columns=lambda x: x.replace("value-", "ensemble ")
    .replace("most-populated-1-", "cluster ")
    .replace("-H2O-2000-nan-", "")
    .replace("-native-2000-nan-", "")
    .replace("-native-2000-3-", "")
    .replace("omega-basic", "Omega")
    .replace("rdkit-ETKDGv3mmff", "RDKit ")
    .replace("-", " ")
    .replace("  ", " ")
    .replace("namfis", "NAMFIS")
    .replace("licuv", "LICUV"),
    inplace=True,
)

dfs["percentage_fulfilled"].index = (
    dfs["percentage_fulfilled"]
    .index.str.replace("_cis", "c")
    .str.replace("_trans", "t")
)
dfs["RMSD"].index = (
    dfs["RMSD"].index.str.replace("_cis", "c").str.replace("_trans", "t")
)

# Sort by index
dfs["percentage_fulfilled"] = dfs["percentage_fulfilled"].sort_index()
dfs["RMSD"] = dfs["RMSD"].sort_index()
dfs["percentage_fulfilled"] *= 100
# fig, axs = plt.subplots(
#     2, 2, figsize=(12, 6), gridspec_kw={"width_ratios": [3, 1]}
# )
# df = dfs["percentage_fulfilled"]
# df = df.drop(columns=["cluster GaMD", "cluster cMD"])

# methods_label = {a: idx for idx, a in enumerate(df)}
# methods_short = {
#     " ".join(a.split("-")[0:2])
#     .replace("value", "")
#     .replace("basic", "Macrocycle"): idx
#     for idx, a in enumerate(df)
# }
# # Scatter plot % fulfilled
# for column in df:
#     axs[0, 0].scatter(
#         df.index.tolist(),
#         df[column].tolist(),
#         label=" ".join(column.split("-")[0:4]),
#     )
# axs[0, 0].set_ylabel("% NOE fulfilled")
# axs[0, 0].set_xlabel("Compounds")
# axs[0, 0].set_ylim([0, 1])

# # Significance heatmap
# t_test_results = np.zeros(shape=(len(methods_label), len(methods_label)))
# wilkoxon_results = np.zeros(shape=(len(methods_label), len(methods_label)))
# fig.autofmt_xdate(rotation=45, ha="center")

# method_pairs = []
# for a in df:
#     for b in df:
#         a_idx = methods_label[a]
#         b_idx = methods_label[b]
#         if a == b:
#             t_test_results[a_idx, b_idx] = 1
#             wilkoxon_results[a_idx, b_idx] = 1
#         else:
#             t_test_results[a_idx, b_idx] = stats.ttest_rel(df[a], df[b], nan_policy="omit").pvalue
#             wilkoxon_results[a_idx, b_idx] = stats.wilcoxon(df[a], df[b]).pvalue
#             method_pairs.append(tuple([a, b]))
# unique_combinations = set(frozenset(combination) for combination in method_pairs)
# method_pairs = [tuple(combination) for combination in unique_combinations]

# # now multi test correction
# pvalues = [t_test_results[methods_label[a], methods_label[b]] for (a, b) in method_pairs]
# _, p_values_corrected, *_ = statsmodels.stats.multitest.multipletests(pvalues)


# colorpalette = sns.color_palette("vlag", as_cmap=True)
# sns.heatmap(
#     t_test_results,
#     vmin=0,
#     vmax=0.1,
#     xticklabels=methods_short.keys(),
#     yticklabels=methods_short.keys(),
#     ax=axs[0, 1],
#     annot=True,
#     cmap=colorpalette,
# )
# axs[0, 1].set_title("Paired t-test")
# sns.heatmap(
#     wilkoxon_results,
#     vmin=0,
#     vmax=0.1,
#     xticklabels=methods_short.keys(),
#     yticklabels=methods_short.keys(),
#     ax=axs[1, 1],
#     annot=True,
#     cmap=colorpalette,
# )
# axs[1, 1].set_title("Wilcoxon signed rank test")

# # Scatter plot RMSD
# df = dfs["RMSD"]
# df = df.drop(columns=["cluster GaMD", "cluster cMD"])
# for column in df:
#     axs[1, 0].scatter(
#         df.index.tolist(),
#         df[column].tolist(),
#         label=" ".join(column.split("-")[0:4]),
#     )
# handles, labels = axs[1, 0].get_legend_handles_labels()
# fig.legend(handles, labels, loc="lower center")
# axs[1, 0].set_ylabel("RMSD [$\AA$]")
# axs[1, 0].set_xlabel("Compounds")

# for tick in axs[1, 0].xaxis.get_major_ticks()[1::2]:
#     tick.set_pad(25)

# fig.autofmt_xdate(rotation=45, ha="center")
# plt.setp(axs[1, 1].get_xticklabels(), rotation=45, ha='right')
# fig.tight_layout()
# # fig.savefig(snakemake.output.plot, dpi=300)
def upper_tri_indexing(A):
    m = A.shape[0]
    r,c = np.triu_indices(m,1)
    return A[r,c]

def upper_tri_index(A):
    m = A.shape[0]
    r,c = np.triu_indices(m,1)
    return (r,c)

def compute_pvalues(df, methods_label, p_pairs):
    # Significance heatmap
    t_test_results = np.zeros(shape=(len(methods_label), len(methods_label))) - 1
    wilkoxon_results = np.zeros(shape=(len(methods_label), len(methods_label))) - 1

    method_pairs = []
    for a in df:
        for b in df:
            a_idx = methods_label[a]
            b_idx = methods_label[b]
            if a == b:
                t_test_results[a_idx, b_idx] = 1
                wilkoxon_results[a_idx, b_idx] = 1
            else:
                t_test_results[a_idx, b_idx] = stats.ttest_rel(df[a], df[b], nan_policy="omit").pvalue
                wilkoxon_results[a_idx, b_idx] = stats.wilcoxon(df[a], df[b], nan_policy="omit").pvalue

                method_pairs.append(tuple([a, b]))
    unique_combinations = set(frozenset(combination) for combination in method_pairs)
    method_pairs = [tuple(combination) for combination in unique_combinations]
    if p_pairs is not None:
        method_pairs = p_pairs


    # multiple correction
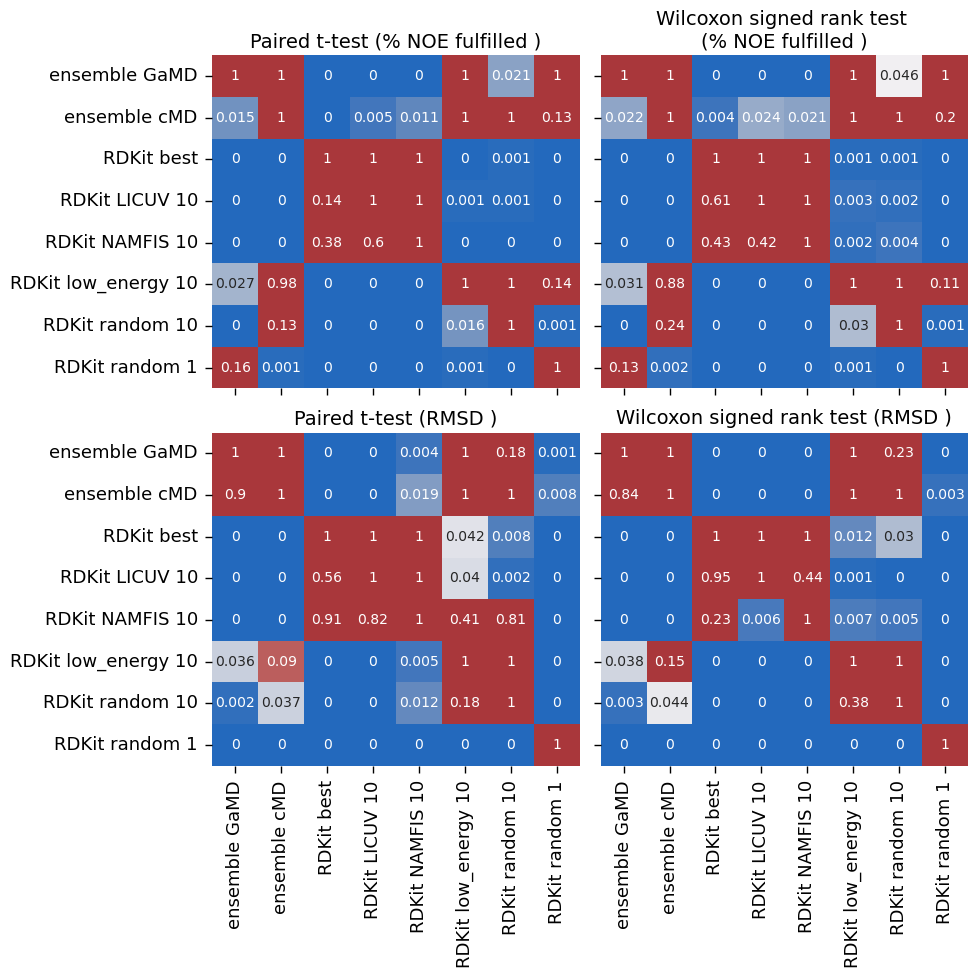
    p_values_raw = np.concatenate((upper_tri_indexing(t_test_results), upper_tri_indexing(wilkoxon_results)))
    _, p_values_corrected, *_ = statsmodels.stats.multitest.multipletests(p_values_raw, method='holm')
    t_test_corrected = p_values_corrected[:len(p_values_corrected)//2]
    wilxox_test_corrected = p_values_corrected[len(p_values_corrected)//2:]
    assert len(t_test_corrected) == len(wilxox_test_corrected)
    t_test_results[upper_tri_index(t_test_results)] = t_test_corrected
    wilkoxon_results[upper_tri_index(wilkoxon_results)] = wilxox_test_corrected

    # Round p values to 3 figs
    t_test_results = t_test_results.round(3)
    wilkoxon_results = wilkoxon_results.round(3)
    pvalues = [t_test_results[methods_label[a], methods_label[b]] for (a, b) in method_pairs]
    return (t_test_results, wilkoxon_results, method_pairs, pvalues)
def arange_data(df_raw, columns):
    df = df_raw[columns]

    methods_label = {a: idx for idx, a in enumerate(df)}
    methods_short = {
    " ".join(a.split("-")[0:2])
    .replace("value", "")
    .replace("basic", "Macrocycle"): idx
    for idx, a in enumerate(df)
    }
    return (df,methods_short)


# compute p-values and correct them!
p_value_store = {}

# %NOE fulfilled
# ['percentage_fulfilled', 'RMSD']
df, methods_short = arange_data(dfs["percentage_fulfilled"], dfs["percentage_fulfilled"].columns)
t_test_results, wilkoxon_results, method_pairs, pvalues = compute_pvalues(df,methods_short, p_pairs=None)
p_value_store['percentage_fulfilled'] = {'t_test': t_test_results, 'w_test':wilkoxon_results, 'methods': methods_short}

# RMSD
df, methods_short = arange_data(dfs["RMSD"], dfs["RMSD"].columns)
t_test_results, wilkoxon_results, method_pairs, pvalues = compute_pvalues(df,methods_short, p_pairs=None)
p_value_store['RMSD'] = {'t_test': t_test_results, 'w_test':wilkoxon_results, 'methods': methods_short}

# Get p-values
def get_p_value_matrix(metric, methods):
    method_list = p_value_store[metric]["methods"]
    method_idx = [method_list[m] for m in methods]
    t_test_matrix = p_value_store[metric]['t_test'][np.ix_(method_idx, method_idx)]
    w_test_matrix = p_value_store[metric]['w_test'][np.ix_(method_idx, method_idx)]

    # Adjust for swapped rows/columns
    for a,m1 in zip(range(t_test_matrix.shape[0]), method_idx):
        for b,m2 in zip(range(t_test_matrix.shape[1]), method_idx):
            if a <= b:
                if m1 > m2:
                    #swap indices, since we swapped rows/columns
                    tmp = t_test_matrix[a,b]
                    t_test_matrix[a,b] = t_test_matrix[b,a]
                    t_test_matrix[b,a] = tmp

                    tmp = w_test_matrix[a,b]
                    w_test_matrix[a,b] = w_test_matrix[b,a]
                    w_test_matrix[b,a] = tmp

    # check that matrices are correct, i.e. that upper triangular has corrected values
    for a in range(t_test_matrix.shape[0]):
        for b in range(t_test_matrix.shape[1]):
            if a <= b:
                assert t_test_matrix[a,b] >= t_test_matrix[b,a]
                assert w_test_matrix[a,b] >= w_test_matrix[b,a]
    return t_test_matrix, w_test_matrix


def get_p_value_1d(metric, method_pairs):
    method_list = p_value_store[metric]["methods"]
    t_1d = []
    w_1d = []

    for a,b in method_pairs:
        a_idx = method_list[a]
        b_idx = method_list[b]

        # ensure retrival of corrected values only (upper triangular matrix)
        if a_idx <= b_idx:
            t_1d.append(p_value_store[metric]['t_test'][a_idx,b_idx])
            w_1d.append(p_value_store[metric]['w_test'][a_idx,b_idx])
        else:
            t_1d.append(p_value_store[metric]['t_test'][b_idx,a_idx])
            w_1d.append(p_value_store[metric]['w_test'][b_idx,a_idx])
    return method_pairs, t_1d, w_1d
/biggin/b147/univ4859/research/snakemake_conda/3e8edaaa94bd3d458d1bfb3dd0ec6b2c_/lib/python3.11/site-packages/scipy/stats/_morestats.py:3414: UserWarning: Exact p-value calculation does not work if there are zeros. Switching to normal approximation.
  warnings.warn("Exact p-value calculation does not work if there are "
def plot_scatter(df, ax, label, limit=None):
    # Scatter plot % fulfilled
    max_value = []
    for column in df:
        ax.scatter(
            df.index.tolist(),
            df[column].tolist(),
            label=" ".join(column.split("-")[0:4]),
        )
        max_value.append(max(df[column].tolist()))

    ax.set_ylabel(label)
    ax.set_xlabel("Compounds")
    if limit is not None:
        ax.set_ylim(limit)
    else:
        ax.set_ylim([0,max(max_value)*1.1])
    return ax

def plot_boxplot(df, ax, label_pairs, pvalues, limit=None):
    # Distributions
    sns.boxplot(data=df, ax=ax, showmeans=True)
#     ax.set_title("Distributions")
#     if limit is None:
#         ax.set_ylim([0,100])

    # Plot p-values in boxplot
#     if len(label_pairs) > 0:
#         annotator = Annotator(ax, label_pairs, data=df)
#         annotator.set_pvalues(pvalues)
#         annotator.configure(verbose=2, comparisons_correction=None, fontsize='x-small', loc='inside')  # text_offset=0,
#         annotator.annotate()
    return ax


def plot_heatmap(ax, data, label, methods_short):
    colorpalette = sns.color_palette("vlag", as_cmap=True)
    sns.heatmap(
        data,
        vmin=0,
        vmax=0.1,
        xticklabels=methods_short.keys(),
        yticklabels=methods_short.keys(),
        ax=ax,
        annot=True,
        cmap=colorpalette,
        cbar=False,
        annot_kws={'size':10},
    )
    ax.set_title(label)
    return ax
def make_plots(dfs, metrics, labels, methods, path1, path2, p_pairs=None):
    fig1, axs1 = plt.subplots(
        2,
        2,
        figsize=(10, 6),
        gridspec_kw={"width_ratios": [3, 1]},
        sharey="row",
        sharex="col",
    )
    fig2, axs2 = plt.subplots(
        2,
        2,
        figsize=(10, 10),
        gridspec_kw={"width_ratios": [1, 1]},
        sharex=True,
        sharey=True,
    )

    # % fulfilled
    df, methods_short = arange_data(dfs[metrics[0]], methods)

    # get p-values
    t_test_results, wilkoxon_results = get_p_value_matrix(metrics[0], methods_short)
    method_pairs, pvalues, _ = get_p_value_1d(metrics[0], p_pairs)
    # Scatter plot
    axs1[0,0] = plot_scatter(df, axs1[0,0], labels[0], [0,105])

    # plot distributions
    axs1[0,1] = plot_boxplot(df, axs1[0,1], method_pairs, pvalues)

    # plot heatmaps
    axs2[0,0] = plot_heatmap(axs2[0,0], t_test_results, f"Paired t-test ({labels[0].split('[')[0]})", methods_short)
    axs2[0,1] = plot_heatmap(axs2[0,1], wilkoxon_results, f"Wilcoxon signed rank test \n({labels[0].split('[')[0]})", methods_short)

    # RMSD
    df, methods_short = arange_data(dfs[metrics[1]], methods)

    # get p-values
    t_test_results, wilkoxon_results = get_p_value_matrix(metrics[1], methods_short)
    method_pairs, pvalues, _ = get_p_value_1d(metrics[1], p_pairs)
    print(method_pairs)
    # Scatter plot
    axs1[1,0] = plot_scatter(df, axs1[1,0], labels[1])

    # plot distributions
    axs1[1,1] = plot_boxplot(df, axs1[1,1], method_pairs, pvalues)

    # plot heatmaps
    axs2[1,0] = plot_heatmap(axs2[1,0], t_test_results,f"Paired t-test ({labels[1].split('[')[0]})", methods_short)
    axs2[1,1] = plot_heatmap(axs2[1,1], wilkoxon_results,f"Wilcoxon signed rank test ({labels[1].split('[')[0]})", methods_short)

    # Clean up figures

    handles, labels = axs1[1, 0].get_legend_handles_labels()
    fig1.legend(handles, labels, loc="upper left", ncol=2, bbox_to_anchor=(0.1,0.1))
    for tick in axs1[1, 0].xaxis.get_major_ticks()[1::2]:
        tick.set_pad(25)

    fig1.autofmt_xdate(rotation=45, ha="center")
    plt.setp(axs1[1, 1].get_xticklabels(), rotation=45, ha='right') # ha is the same as horizontalalignment
    fig2.autofmt_xdate(rotation=90, ha="center")
    fig1.tight_layout()
    fig1.savefig(path1, dpi=300)
    fig2.tight_layout()
    fig2.savefig(path2, dpi=300)
make_plots(
    dfs,
    ['percentage_fulfilled', 'RMSD'],
    ["% NOE fulfilled [%]", "RMSD [$\AA$]"],
    ["ensemble GaMD", "ensemble cMD"],
    snakemake.output.plot1,
    snakemake.output.plot1_sig,
    [("ensemble GaMD", "ensemble cMD")]
)
/biggin/b147/univ4859/research/snakemake_conda/3e8edaaa94bd3d458d1bfb3dd0ec6b2c_/lib/python3.11/site-packages/seaborn/categorical.py:82: FutureWarning: iteritems is deprecated and will be removed in a future version. Use .items instead.
  plot_data = [np.asarray(s, float) for k, s in iter_data]
/biggin/b147/univ4859/research/snakemake_conda/3e8edaaa94bd3d458d1bfb3dd0ec6b2c_/lib/python3.11/site-packages/seaborn/categorical.py:82: FutureWarning: iteritems is deprecated and will be removed in a future version. Use .items instead.
  plot_data = [np.asarray(s, float) for k, s in iter_data]
[('ensemble GaMD', 'ensemble cMD')]
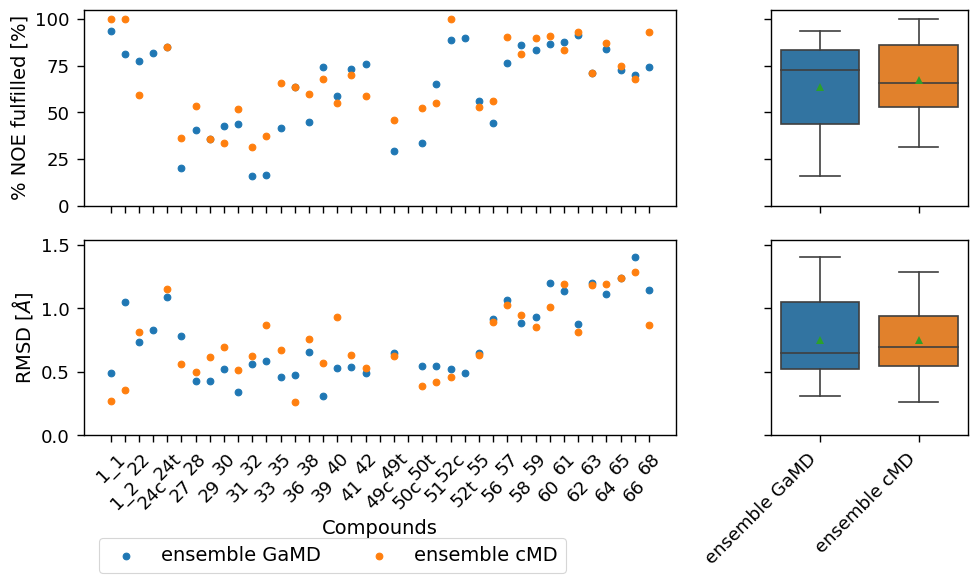
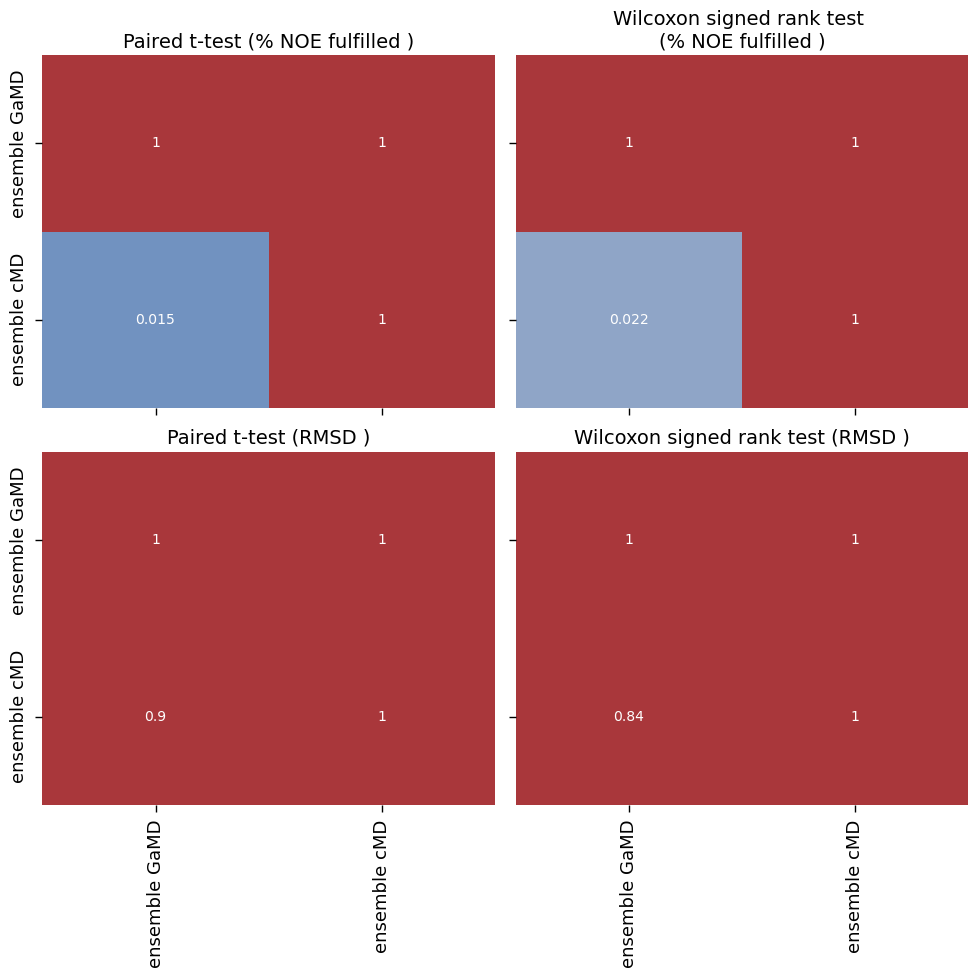
make_plots(
    dfs,
    ['percentage_fulfilled', 'RMSD'],
    ["% NOE fulfilled [%]", "RMSD [$\AA$]"],
    ["ensemble GaMD", "ensemble cMD", "Omega best", "RDKit best"],
    snakemake.output.plot2,
    snakemake.output.plot2_sig,
    [
        ("ensemble GaMD", "Omega best"),
        ("ensemble cMD", "Omega best"),
        ("ensemble GaMD", "RDKit best"),
        ("ensemble cMD", "RDKit best"),
        ("Omega best", "RDKit best")
    ]
)
/biggin/b147/univ4859/research/snakemake_conda/3e8edaaa94bd3d458d1bfb3dd0ec6b2c_/lib/python3.11/site-packages/seaborn/categorical.py:82: FutureWarning: iteritems is deprecated and will be removed in a future version. Use .items instead.
  plot_data = [np.asarray(s, float) for k, s in iter_data]
/biggin/b147/univ4859/research/snakemake_conda/3e8edaaa94bd3d458d1bfb3dd0ec6b2c_/lib/python3.11/site-packages/seaborn/categorical.py:82: FutureWarning: iteritems is deprecated and will be removed in a future version. Use .items instead.
  plot_data = [np.asarray(s, float) for k, s in iter_data]
[('ensemble GaMD', 'Omega best'), ('ensemble cMD', 'Omega best'), ('ensemble GaMD', 'RDKit best'), ('ensemble cMD', 'RDKit best'), ('Omega best', 'RDKit best')]
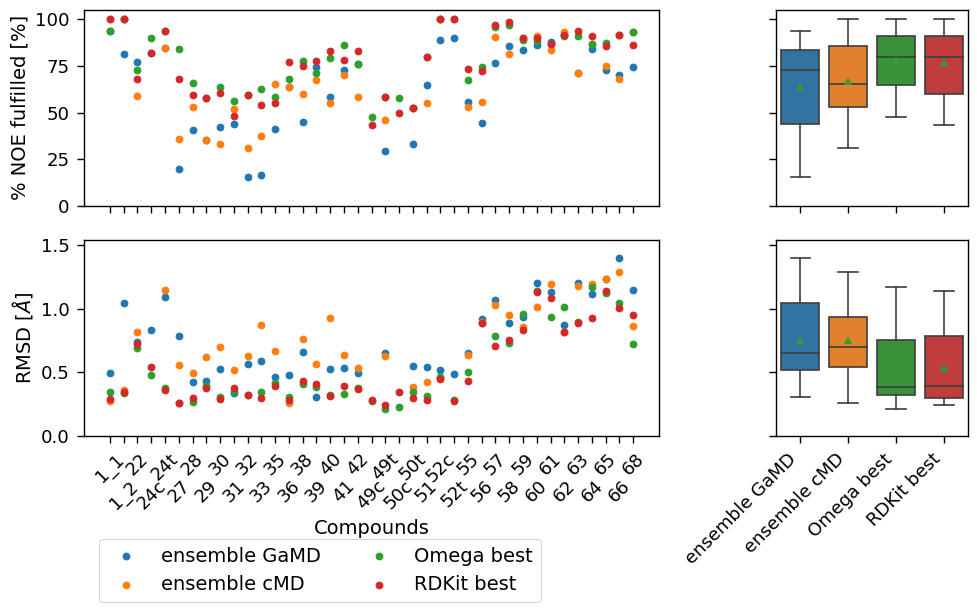
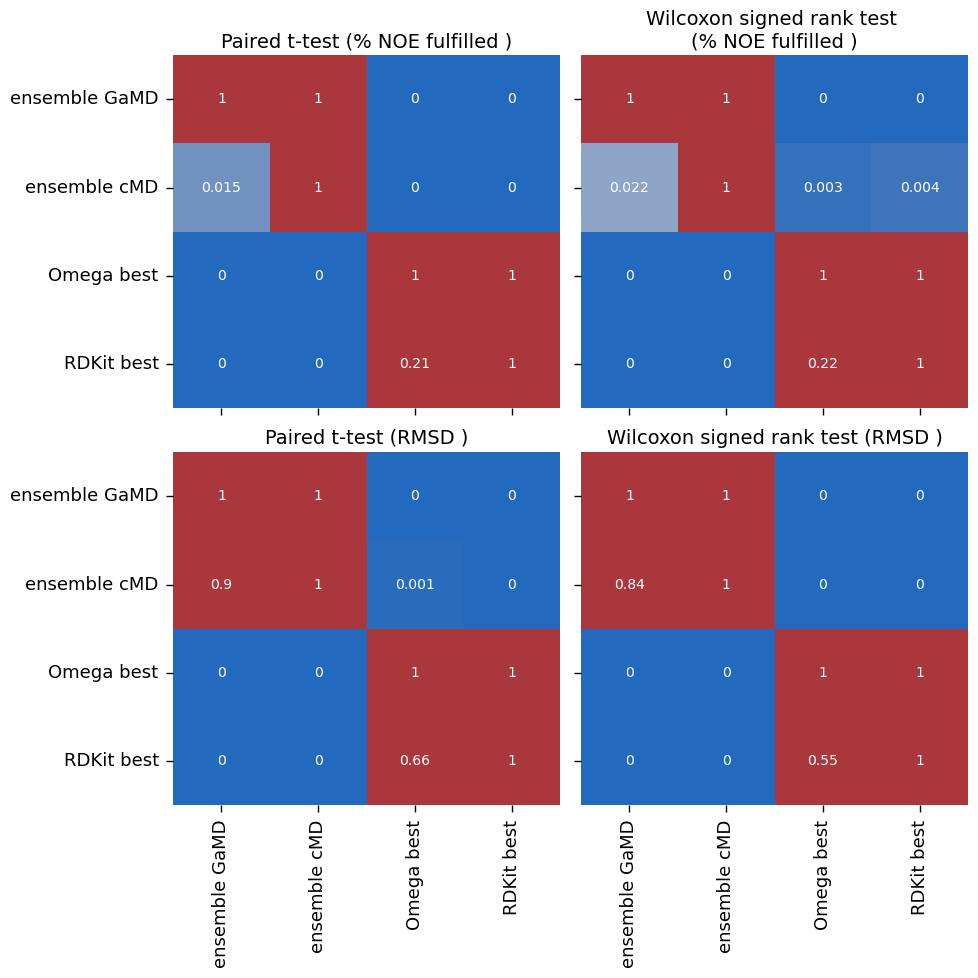
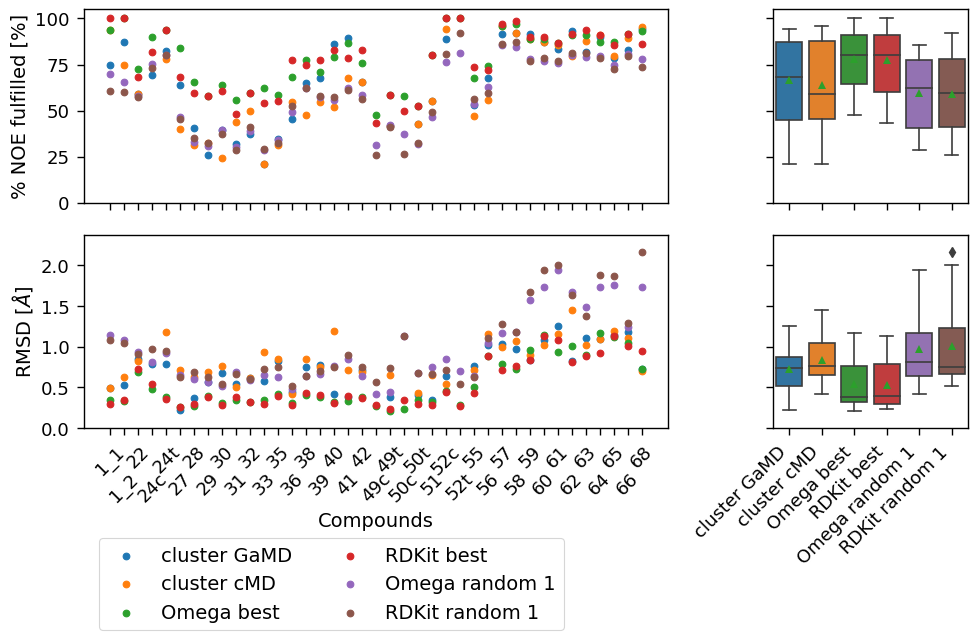
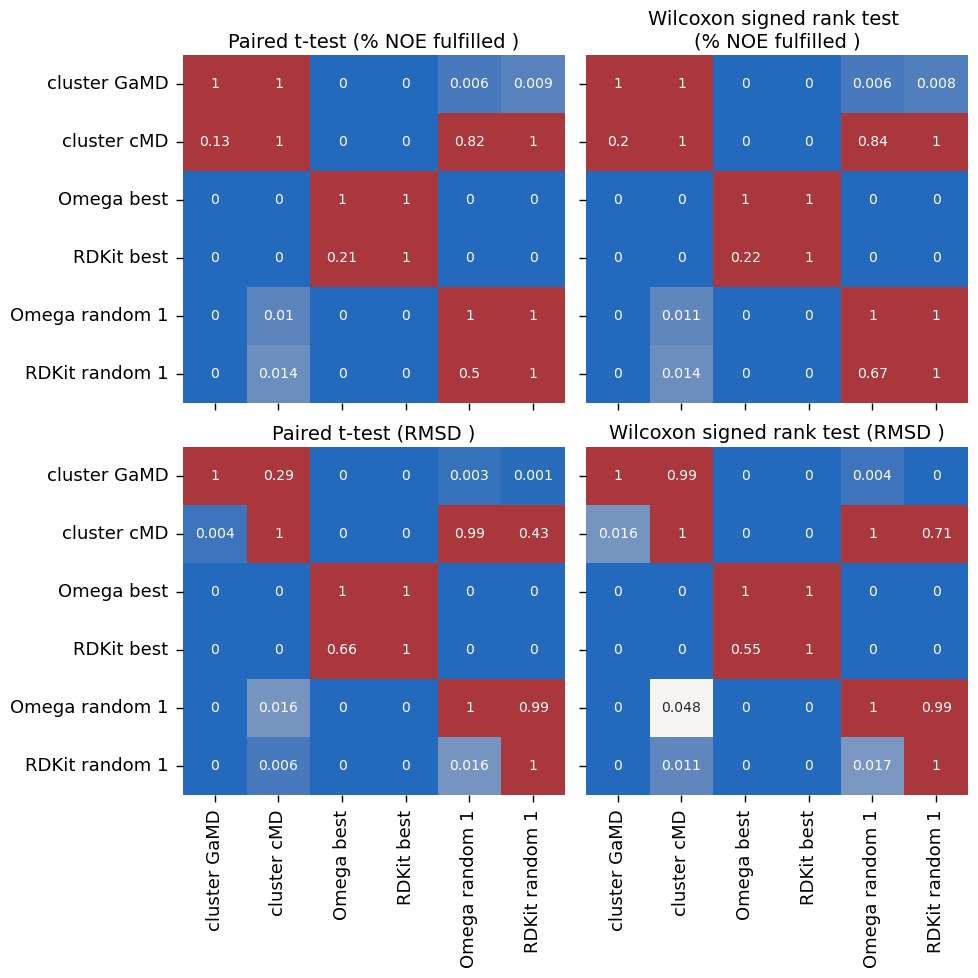
make_plots(
    dfs,
    ['percentage_fulfilled', 'RMSD'],
    ["% NOE fulfilled [%]", "RMSD [$\AA$]"],
    ["cluster GaMD", "cluster cMD", "Omega best", "RDKit best", "Omega random 1","RDKit random 1"],
    snakemake.output.plot3,
    snakemake.output.plot3_sig,
    [
#         ("cluster GaMD", "Omega best"),
#         ("cluster cMD", "Omega best"),
#         ("cluster GaMD", "RDKit best"),
#         ("cluster cMD", "RDKit best"),
        ("cluster GaMD", "Omega random 1"),
        ("cluster cMD", "Omega random 1"),
#         ("cluster GaMD", "RDKit random 1"),
#         ("cluster cMD", "RDKit random 1"),
        ("Omega best", "Omega random 1"),
#         ("RDKit best", "RDKit random 1")
    ]
)
/biggin/b147/univ4859/research/snakemake_conda/3e8edaaa94bd3d458d1bfb3dd0ec6b2c_/lib/python3.11/site-packages/seaborn/categorical.py:82: FutureWarning: iteritems is deprecated and will be removed in a future version. Use .items instead.
  plot_data = [np.asarray(s, float) for k, s in iter_data]
/biggin/b147/univ4859/research/snakemake_conda/3e8edaaa94bd3d458d1bfb3dd0ec6b2c_/lib/python3.11/site-packages/seaborn/categorical.py:82: FutureWarning: iteritems is deprecated and will be removed in a future version. Use .items instead.
  plot_data = [np.asarray(s, float) for k, s in iter_data]
[('cluster GaMD', 'Omega random 1'), ('cluster cMD', 'Omega random 1'), ('Omega best', 'Omega random 1')]
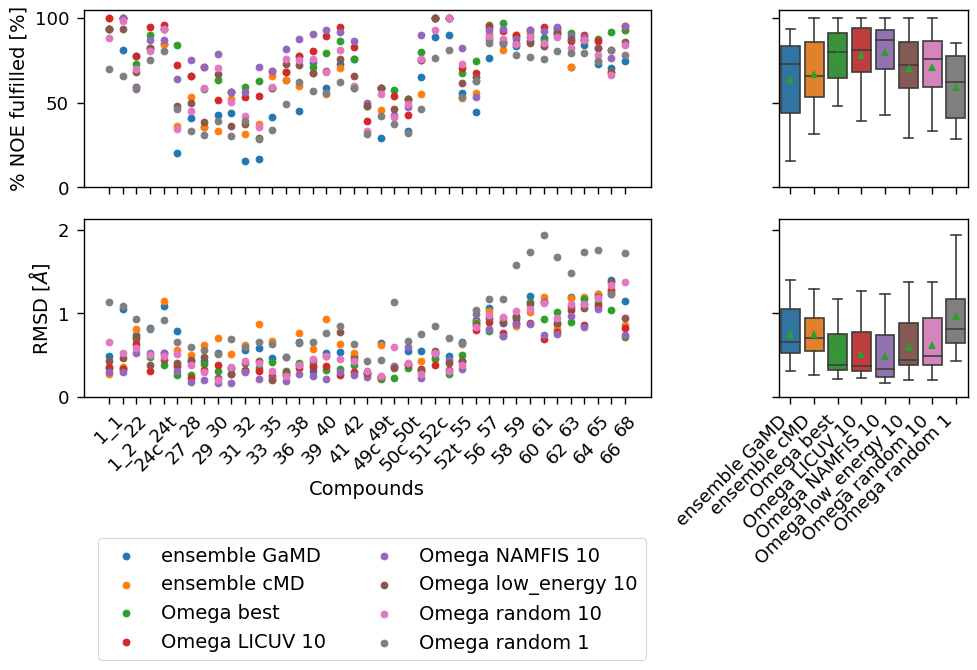
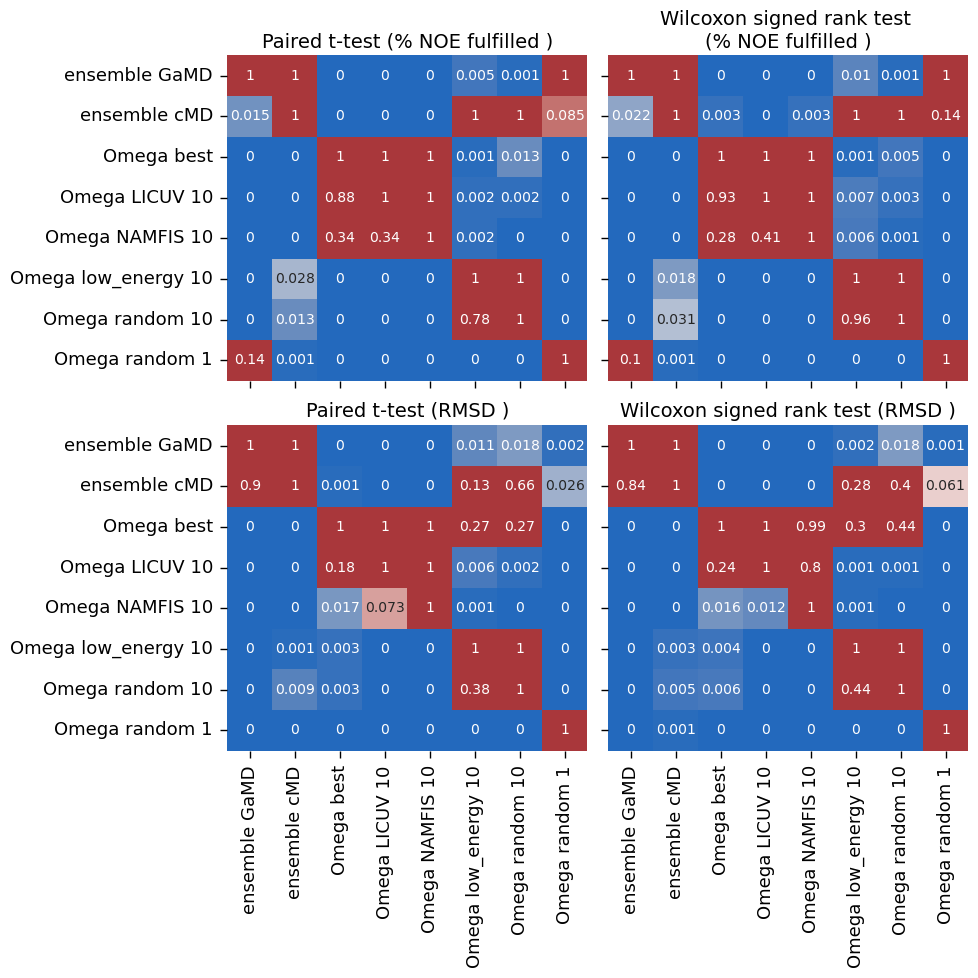
make_plots(
    dfs,
    ['percentage_fulfilled', 'RMSD'],
    ["% NOE fulfilled [%]", "RMSD [$\AA$]"],
    ["ensemble GaMD", "ensemble cMD", "Omega best", "Omega LICUV 10", "Omega NAMFIS 10", "Omega low_energy 10",
     "Omega random 10","Omega random 1"],
    snakemake.output.plot4,
    snakemake.output.plot4_sig,
    [
        ("Omega low_energy 10", "Omega random 10"),
#         ("Omega LICUV 10", "Omega random 10"),
        ("Omega NAMFIS 10", "Omega random 10"),
#         ("Omega best", "Omega LICUV 10"),
#         ("Omega best", "Omega NAMFIS 10"),
        ("ensemble cMD", "Omega random 10"),
        ("ensemble cMD", "Omega low_energy 10"),
        ("ensemble GaMD", "Omega random 10"),
        ("ensemble GaMD", "Omega low_energy 10"),

    ]
)
/biggin/b147/univ4859/research/snakemake_conda/3e8edaaa94bd3d458d1bfb3dd0ec6b2c_/lib/python3.11/site-packages/seaborn/categorical.py:82: FutureWarning: iteritems is deprecated and will be removed in a future version. Use .items instead.
  plot_data = [np.asarray(s, float) for k, s in iter_data]
[('Omega low_energy 10', 'Omega random 10'), ('Omega NAMFIS 10', 'Omega random 10'), ('ensemble cMD', 'Omega random 10'), ('ensemble cMD', 'Omega low_energy 10'), ('ensemble GaMD', 'Omega random 10'), ('ensemble GaMD', 'Omega low_energy 10')]
/biggin/b147/univ4859/research/snakemake_conda/3e8edaaa94bd3d458d1bfb3dd0ec6b2c_/lib/python3.11/site-packages/seaborn/categorical.py:82: FutureWarning: iteritems is deprecated and will be removed in a future version. Use .items instead.
  plot_data = [np.asarray(s, float) for k, s in iter_data]
make_plots(
    dfs,
    ['percentage_fulfilled', 'RMSD'],
    ["% NOE fulfilled [%]", "RMSD [$\AA$]"],
    ["ensemble GaMD", "ensemble cMD", "RDKit best", "RDKit LICUV 10", "RDKit NAMFIS 10", "RDKit low_energy 10",
     "RDKit random 10", "RDKit random 1"],
    snakemake.output.plot5,
    snakemake.output.plot5_sig,
    [
        ("RDKit low_energy 10", "RDKit random 10"),
#         ("RDKit LICUV 10", "RDKit random 10"),
        ("RDKit NAMFIS 10", "RDKit random 10"),
#         ("RDKit best", "RDKit LICUV 10"),
#         ("RDKit best", "RDKit NAMFIS 10"),
        ("ensemble cMD", "RDKit random 10"),
        ("ensemble cMD", "RDKit low_energy 10"),
        ("ensemble GaMD", "RDKit random 10"),
        ("ensemble GaMD", "RDKit low_energy 10"),
    ]
)
/biggin/b147/univ4859/research/snakemake_conda/3e8edaaa94bd3d458d1bfb3dd0ec6b2c_/lib/python3.11/site-packages/seaborn/categorical.py:82: FutureWarning: iteritems is deprecated and will be removed in a future version. Use .items instead.
  plot_data = [np.asarray(s, float) for k, s in iter_data]
/biggin/b147/univ4859/research/snakemake_conda/3e8edaaa94bd3d458d1bfb3dd0ec6b2c_/lib/python3.11/site-packages/seaborn/categorical.py:82: FutureWarning: iteritems is deprecated and will be removed in a future version. Use .items instead.
  plot_data = [np.asarray(s, float) for k, s in iter_data]
[('RDKit low_energy 10', 'RDKit random 10'), ('RDKit NAMFIS 10', 'RDKit random 10'), ('ensemble cMD', 'RDKit random 10'), ('ensemble cMD', 'RDKit low_energy 10'), ('ensemble GaMD', 'RDKit random 10'), ('ensemble GaMD', 'RDKit low_energy 10')]
# Combine plots 4,5
import svgutils.transform as sg
import sys

#create new SVG figure
fig = sg.SVGFigure("17.1cm", "23cm")

# load matpotlib-generated figures
fig1 = sg.fromfile(snakemake.output.plot4)
fig2 = sg.fromfile(snakemake.output.plot5)

# get the plot objects
plot1 = fig1.getroot()
plot2 = fig2.getroot()
plot1.moveto(0,20)
plot2.moveto(0, 520)

# add text labels
txt1 = sg.TextElement(5,20, "A", size=20, weight="bold")
txt2 = sg.TextElement(5,530, "B", size=20, weight="bold")

# append plots and labels to figure
fig.append([plot1, plot2])
fig.append([txt1, txt2])

# save generated SVG files
fig.save(snakemake.output.plot6)
dfs["percentage_fulfilled"].describe().round(decimals = 2).T
| count | mean | std | min | 25% | 50% | 75% | max | |
|---|---|---|---|---|---|---|---|---|
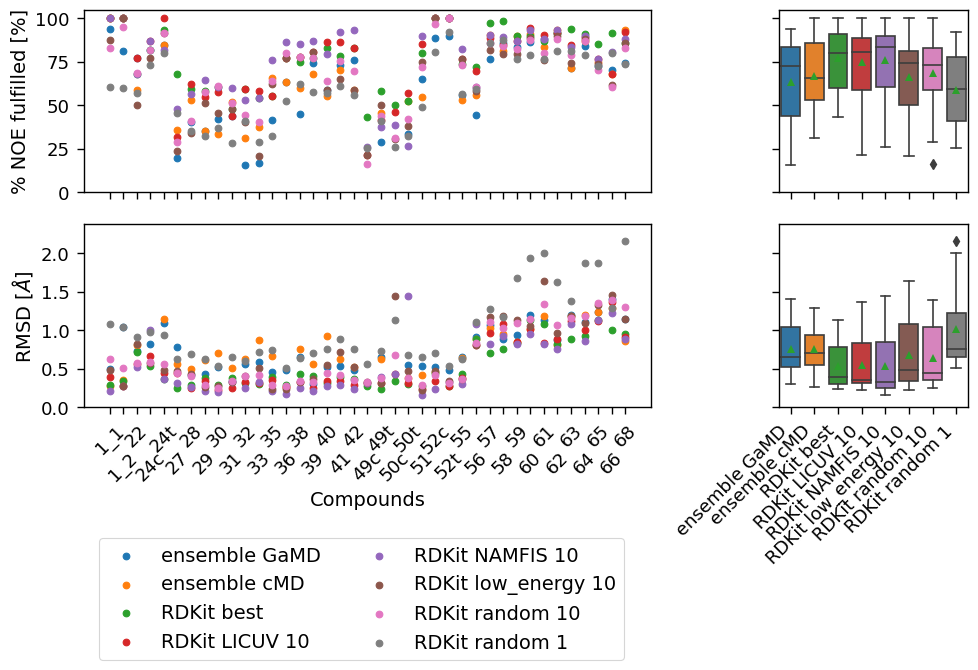
| ensemble GaMD | 37.0 | 63.69 | 23.28 | 15.62 | 44.00 | 72.82 | 83.53 | 93.75 |
| cluster GaMD | 36.0 | 66.76 | 22.50 | 20.83 | 44.81 | 68.49 | 87.50 | 94.19 |
| ensemble cMD | 35.0 | 67.10 | 20.77 | 31.25 | 53.03 | 65.52 | 85.89 | 100.00 |
| cluster cMD | 35.0 | 63.75 | 23.51 | 20.83 | 45.53 | 59.09 | 87.69 | 95.83 |
| Omega best | 39.0 | 78.26 | 15.35 | 47.83 | 64.63 | 80.00 | 90.98 | 100.00 |
| Omega LICUV 10 | 39.0 | 78.41 | 17.48 | 39.13 | 67.81 | 80.85 | 94.24 | 100.00 |
| Omega low_energy 10 | 39.0 | 70.64 | 19.09 | 29.17 | 58.48 | 72.50 | 85.99 | 100.00 |
| Omega random 1 | 39.0 | 59.27 | 19.03 | 28.33 | 40.74 | 62.00 | 77.54 | 85.42 |
| Omega random 10 | 39.0 | 70.94 | 18.81 | 33.04 | 59.01 | 75.81 | 86.13 | 100.00 |
| Omega NAMFIS 10 | 39.0 | 79.76 | 16.33 | 42.86 | 69.90 | 86.96 | 92.68 | 100.00 |
| RDKit best | 39.0 | 77.22 | 16.96 | 43.48 | 59.99 | 80.00 | 91.24 | 100.00 |
| RDKit LICUV 10 | 39.0 | 74.97 | 20.12 | 21.74 | 58.85 | 80.65 | 88.94 | 100.00 |
| RDKit low_energy 10 | 39.0 | 66.15 | 22.52 | 20.83 | 50.00 | 74.24 | 81.29 | 100.00 |
| RDKit random 1 | 39.0 | 58.86 | 19.96 | 25.65 | 41.04 | 59.30 | 77.79 | 92.00 |
| RDKit random 10 | 39.0 | 68.65 | 20.36 | 16.52 | 58.94 | 72.94 | 83.02 | 100.00 |
| RDKit NAMFIS 10 | 39.0 | 75.76 | 20.60 | 26.09 | 60.54 | 83.33 | 90.00 | 100.00 |
dfs["RMSD"].describe().round(decimals = 2).T
| count | mean | std | min | 25% | 50% | 75% | max | |
|---|---|---|---|---|---|---|---|---|
| ensemble GaMD | 37.0 | 0.75 | 0.30 | 0.31 | 0.52 | 0.65 | 1.05 | 1.40 |
| cluster GaMD | 36.0 | 0.73 | 0.27 | 0.23 | 0.52 | 0.74 | 0.88 | 1.26 |
| ensemble cMD | 35.0 | 0.75 | 0.29 | 0.26 | 0.54 | 0.70 | 0.94 | 1.29 |
| cluster cMD | 35.0 | 0.84 | 0.26 | 0.42 | 0.65 | 0.76 | 1.05 | 1.46 |
| Omega best | 39.0 | 0.54 | 0.30 | 0.21 | 0.32 | 0.38 | 0.76 | 1.17 |
| Omega LICUV 10 | 39.0 | 0.51 | 0.28 | 0.22 | 0.31 | 0.37 | 0.77 | 1.27 |
| Omega low_energy 10 | 39.0 | 0.60 | 0.32 | 0.20 | 0.38 | 0.44 | 0.89 | 1.37 |
| Omega random 1 | 39.0 | 0.97 | 0.44 | 0.42 | 0.64 | 0.81 | 1.17 | 1.94 |
| Omega random 10 | 39.0 | 0.62 | 0.34 | 0.20 | 0.38 | 0.49 | 0.95 | 1.37 |
| Omega NAMFIS 10 | 39.0 | 0.48 | 0.30 | 0.16 | 0.24 | 0.33 | 0.74 | 1.23 |
| RDKit best | 39.0 | 0.53 | 0.29 | 0.24 | 0.30 | 0.39 | 0.79 | 1.14 |
| RDKit LICUV 10 | 39.0 | 0.55 | 0.33 | 0.23 | 0.31 | 0.36 | 0.84 | 1.37 |
| RDKit low_energy 10 | 39.0 | 0.68 | 0.41 | 0.22 | 0.34 | 0.49 | 1.08 | 1.64 |
| RDKit random 1 | 39.0 | 1.01 | 0.47 | 0.52 | 0.66 | 0.75 | 1.23 | 2.16 |
| RDKit random 10 | 39.0 | 0.64 | 0.38 | 0.25 | 0.35 | 0.45 | 1.05 | 1.40 |
| RDKit NAMFIS 10 | 39.0 | 0.54 | 0.37 | 0.16 | 0.25 | 0.33 | 0.85 | 1.44 |
# stats.ttest_rel(df['GaMD-H2O-2000-nan-'], df[f"{'-'.join(snakemake.wildcards.methods.split('-')[-2:])} best"], nan_policy='omit')
# stats.wilcoxon(df['GaMD-H2O-2000-nan-'], df[f"{'-'.join(snakemake.wildcards.methods.split('-')[-2:])} best"])
# stats.ttest_rel(df['GaMD-H2O-2000-nan-'], df['cMD-H2O-2000-nan-'], nan_policy='omit')
# stats.wilcoxon(df['GaMD-H2O-2000-nan-'], df['cMD-H2O-2000-nan-'], alternative='two-sided')
# stats.ttest_rel(df['cMD-H2O-2000-nan-'], df[f"{'-'.join(snakemake.wildcards.methods.split('-')[-2:])} best"], nan_policy='omit')
# stats.wilcoxon(df['cMD-H2O-2000-nan-'], df[f"{'-'.join(snakemake.wildcards.methods.split('-')[-2:])} best"], alternative='two-sided')
